Figures & data
Figure 1. Sample means of graduation from university education, males (left) and females (right).
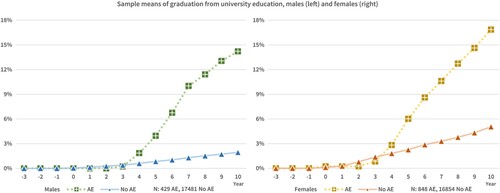
Table 1. Sample means for treated and potential control group, and p-values for the difference in means between treated and potential control group, and between treated and matched controls.
Figure 2. Estimates of ATT, full sample of males (left) and females (right) aged 20-50, 95% CI:s.
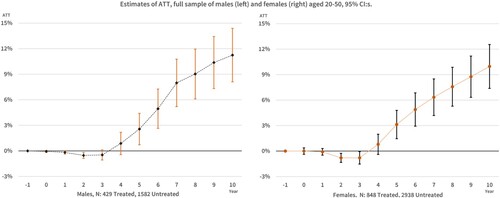
Figure 3. Estimates of ATT, males aged 20–27 using the main specification of the propensity score model (left) and main specification plus GPA (right), 95% CI:s.
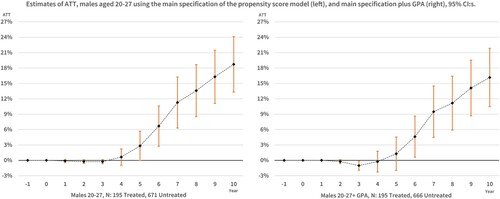
Figure 4. Estimates of ATT, females aged 20–27 using the main specification of the propensity score model (left) and main specification plus GPA (right), 95% CI:s.
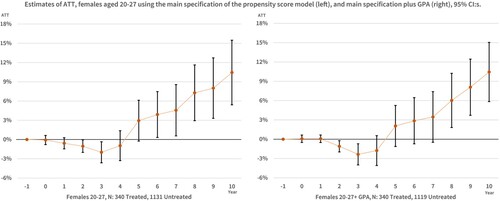
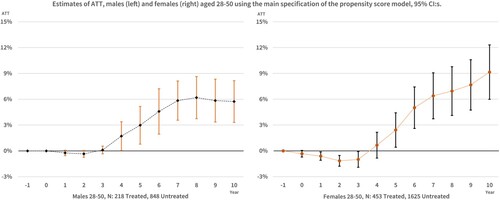
Figure 5. Estimates of ATT, males (left) and females (right) aged 28–50 using the main specification of the propensity score model, 95% CI:s.