
Figures & data
Figure 1. Types of graduate migration. Source: Faggian, McCann, and Sheppard (Citation2007).
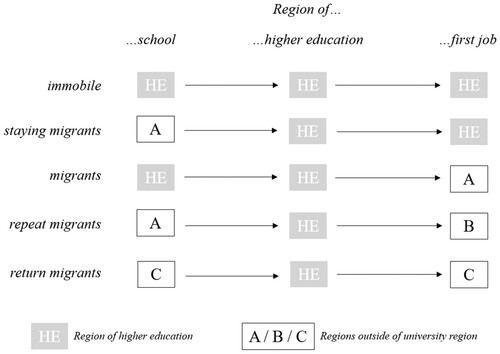
Figure 2. Survival function (Kaplan-Meier estimates) for graduates. Source: University panel linked to the IEB of IAB, own calculations.
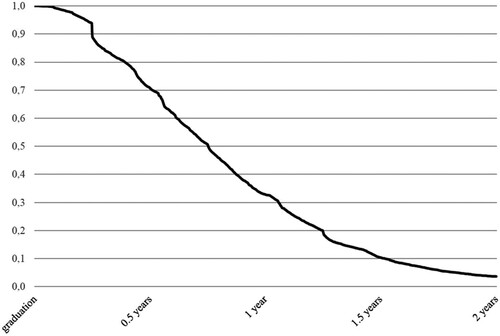
Table 1. Regression results – determinants of transition time into first regular full-time and part-time jobs.
Table 2. Regression results – mobility types and transition time into first regular full-time and part-time jobs.
Table 3. Regression results – sector-specific and non-specific work experience and transition time into first regular full-time and part-time jobs.
Table 4. Regression results – work experience during 3-, 6- and 12-month periods before graduation and transition time into first regular full-time and part-time jobs.
Figure 3. Effect of field of study on time to first job. Source: university panel linked to the IEB of IAB, own calculations.
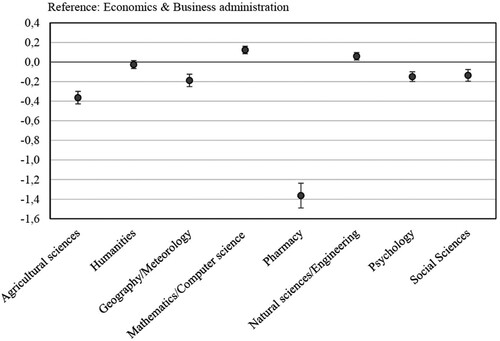
Figure 4. Effects of graduation year on the likelihood of finding a job. Source: university panel linked to the IEB of IAB, own calculations.
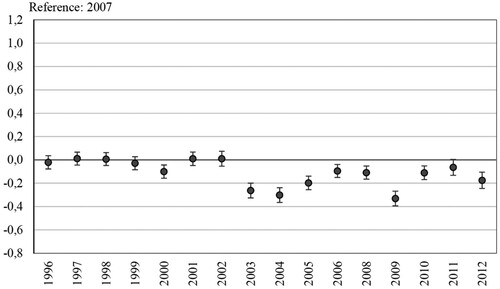
Table A1. Description of explanatory variables.
Table A2. Summary statistics – mobility and control variables.
Table A3. Summary statistics – work experience.