
Figures & data
Table 1. Data available for both school grades and SIMCE test scores.
Table 2. Gender test score gap, by evaluation scheme.
Table 3. Descriptive statistics.
Table 4. Estimation of gender gap in grading.
Figure 1. Gender gap in grading using different year-grade combinations: (a) Spanish and (b) Math.
Notes: These figures show the estimates of γ in Equation (Equation5(5)
(5) ) with 95% confidence interval for each year-grade combination.
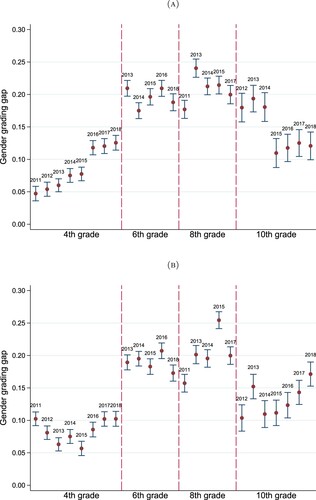
Figure 2. Gender gap in grading and students' ability: (a) Spanish and (b) Math.
Notes: These figures illustrate the relationship between the grading gap (non-blind minus blind test scores) and students' ability for female and male students. Students' ability corresponds to grade 4 SIMCE test scores. Lines are local polynomial smoothed curves of degree zero using an epanechnikov kernel function with shaded 95% confidence intervals.
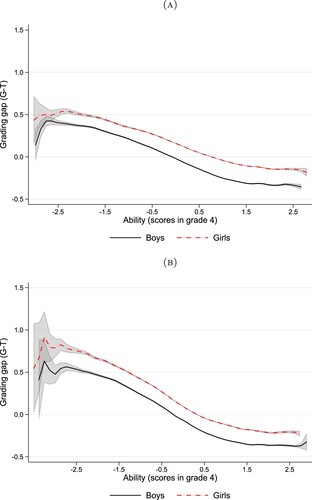
Table 5. Gender grading gap by student's ability.
Table 6. Regression of teacher's grading gap across classes.
Table 7. Regression of gender gap between subjects within the same class.
Table 8. Stepwise regression: variation of gender grading gap.
Table 9. Gender gap in behaviour.
Table 10. Effects of student behaviour on gender grading gaps.