
Figures & data
Figure 1. Violin plot indicating the connection between the share of poor students and Roma students within the schools:school principals’ estimates.
Note: Data: NABC 2021, 8th grader sample, own calculation.
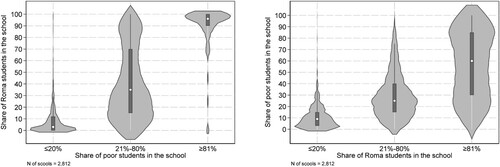
Table 1. The characteristics of sample schools, relative to all Hungarian primary schools.
Figure 2. Sample vignettes to rate (non)-poor and (non)-Roma students.
Note: Words that appear in the [squared brackets] are the alternative word used in other vignettes.
![Figure 2. Sample vignettes to rate (non)-poor and (non)-Roma students.Note: Words that appear in the [squared brackets] are the alternative word used in other vignettes.](/cms/asset/3abbfe8c-ee73-448b-bfb2-9266a7b23ea0/cede_a_2372558_f0002_ob.jpg)
Figure 3. Teacher’s perceptions of students’ school performance.
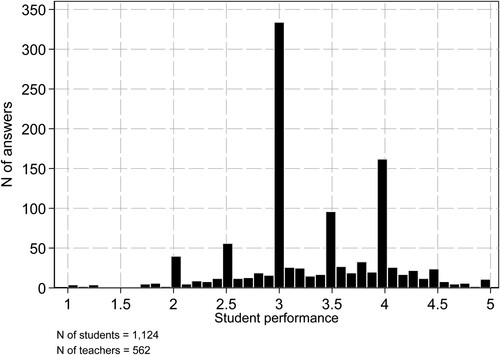
Figure 4. Teachers’ perceptions of (non)-poor and (non)-Roma students’ average school performance under different classroom compositions.
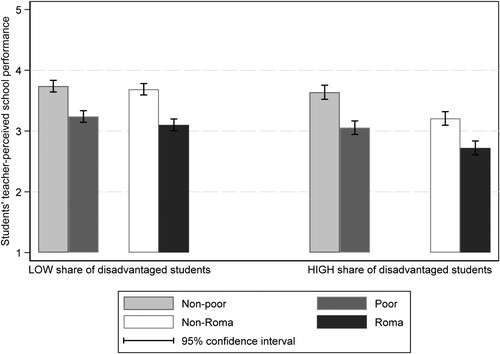
Table 2. Compositional effects in students’ teacher-perceived school performance.