Figures & data
Table 1. Museums analysed. Source: Own elaboration based on data (AECOM Citation2021) and (Ministerio de Cultura y Deporte. Gobierno de España Citation2021).
Table 2. Main metrics of Museums’ SM.
Table 3. Technical sheet for content analysis.
Table 4. Main SM metrics during Stage 1- Isolation.
Table 5. Main SM metrics Stage 2.
Table 6. Coincidences of content between Instagram and Twitter.
Figure 1. Regression Model-1 based on general metrics of SM.
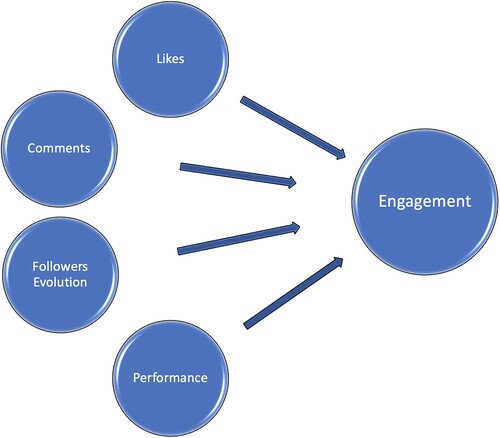
Figure 2. Regression Model-2 based on analysis content for the detailed published content.
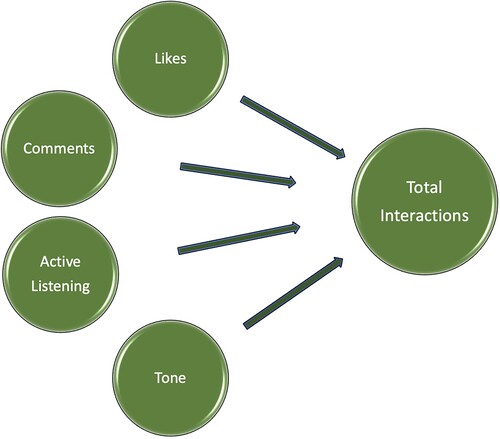
Table 7. Endogenous variable: Engagement. OLS.
Table 8. Endogenous variable: total interactions.
Table 9. Endogenous variable: total interactions. Bootstrap.
Figure 3. Domain dessagregated by Stage and SM.
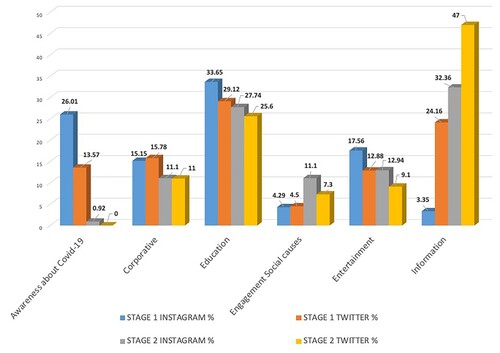
Figure 4. National Art Museum of Catalonia 3 April 2020.
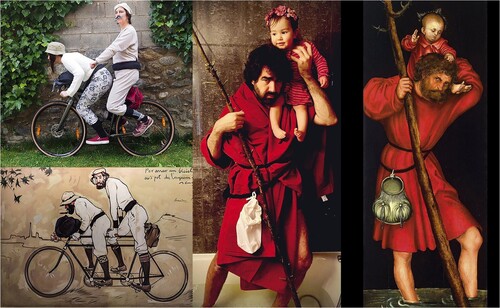
Figure 5. National Museum of Art of Catalonia 8 May 2020.
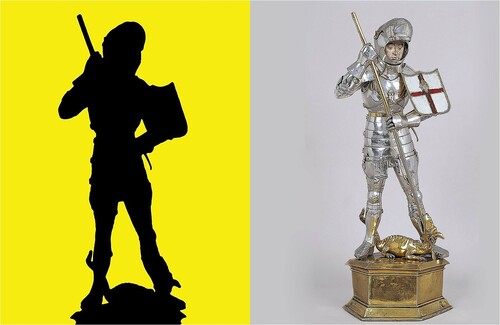
Figure 6. Style dessagregated by Stage and SM.
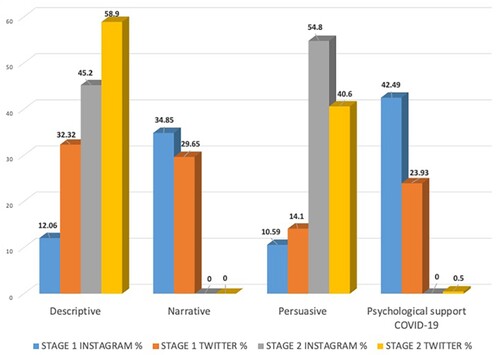
Figure 7. Emotions dessagregated by Stage and SM.
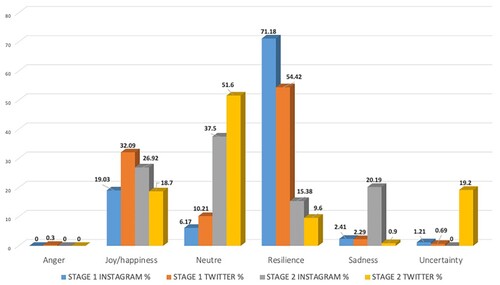
Figure 8. WordsClouds Stage 1 and WordsCloud Stage 2.

Figure 9. Hashtags WordsClouds Stage 1 and WordsCloud Stage 2.
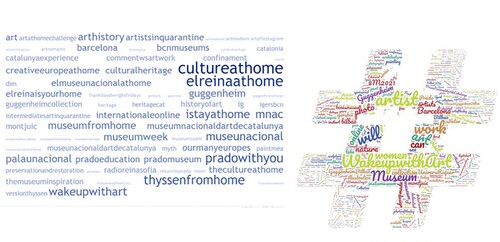
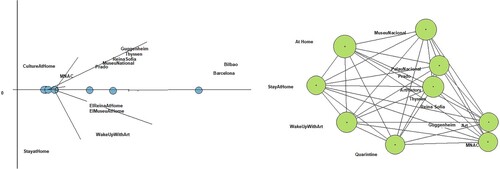
Figure 10. Concurrence Word and SM Stage 1.