3,658
Views
1
CrossRef citations to date
0
Altmetric
Research Article

Marketing unhealthy brands – an analysis of SKU pricing, pack size and promotion strategies that increase harmful product consumption

ORCID Icon, , ORCID Icon & ORCID Icon
Pages 187-202 | Received 27 Aug 2022, Accepted 27 Jan 2023, Published online: 23 Feb 2023

Figures & data

Table 1. Sample of brand variants and product categories investigated in each retail audit wave.

Table 2. Cadbury Dairy Milk SKU prices (AU$) by city/state – retail audit wave 2.

Table 3. Brand variant SKU pack options and prices (AU$), ordered by size – retail audit wave 2.

Figure 1. Wave 1 unhealthy brand ratios of lowest to highest price per volume SKUs (including SKUs with maximum & minimum price per volume, SKU pack size & price).
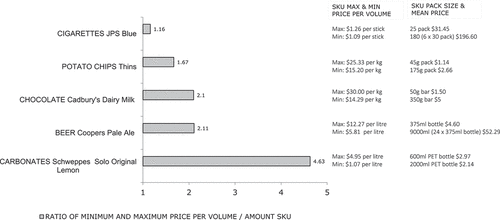
Source: National mean SKU price based on first retail audit wave prices across the eight locations. NB. Prices are rounded to the nearest cents, and ratios to two decimal places.
Figure 1. Wave 1 unhealthy brand ratios of lowest to highest price per volume SKUs (including SKUs with maximum & minimum price per volume, SKU pack size & price).
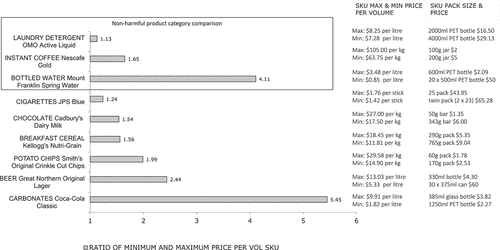
Figure 2. Wave 2 Unhealthy and comparison brand ratios of lowest to highest price per volume SKUs (including SKUs with maximum & minimum price per volume, SKU pack size & price).

Source: National mean SKU price based on second retail audit wave of prices across the eight locations.NB. Prices are rounded to the nearest cents, and ratios to two decimal places.
Figure 2. Wave 2 Unhealthy and comparison brand ratios of lowest to highest price per volume SKUs (including SKUs with maximum & minimum price per volume, SKU pack size & price).

Table 4. Regulatory recommendations for unhealthy product brand SKU price promotion.