Figures & data
Table 1. Retrieval strategies during collaborative interviews, coded according to the coding scheme proposed by Vredeveldt and Van Koppen (Citation2018). Means (M) and standard deviations (SD) for the frequency of each strategy per interview in the two collaborative conditions.
Figure 1. Mean number of non-redundant correct details reported in each interview by nominal, acquainted and unacquainted pairs. Bars for Interview 1 reflect baseline performance; bars for Interview 2 and 3 reflect the addition of new correct information not previously mentioned by either pair member in a previous interview. Error bars represent 95% confidence intervals.
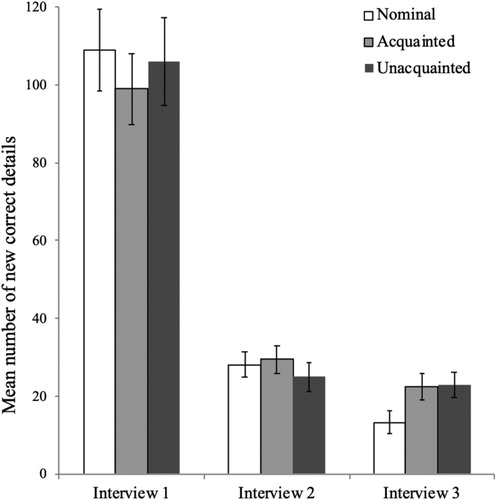
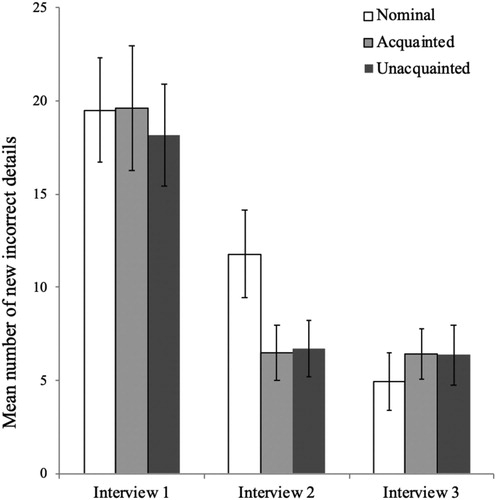
Figure 2. Mean number of non-redundant incorrect details reported in each interview by nominal, acquainted and unacquainted pairs. Bars for Interview 1 reflect baseline performance; bars for Interview 2 and 3 reflect the addition of new incorrect information not previously mentioned by either pair member in a previous interview. Error bars represent 95% confidence intervals.