
Figures & data
Figure 1. Diagram of the procedure.
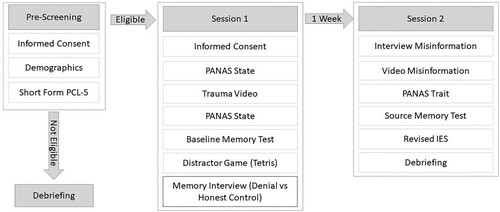
Figure 2. Proportion of true memory for the interview by lying condition.
Note: Each dot represents one participant. Means are represented by bars. *** = p < .001.
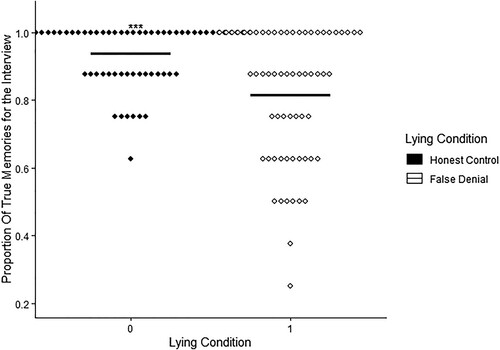
Figure 3. Proportion of false memory for the interview by lying condition.
Note: Each dot represents one participant. Means are represented by bars. *** = p < .001.
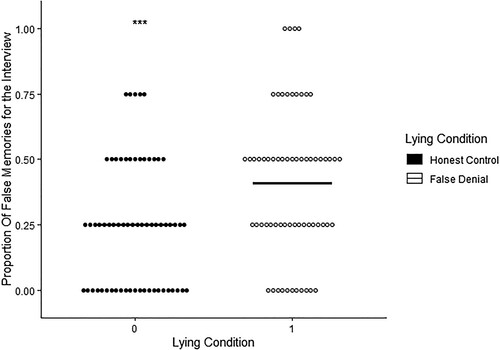
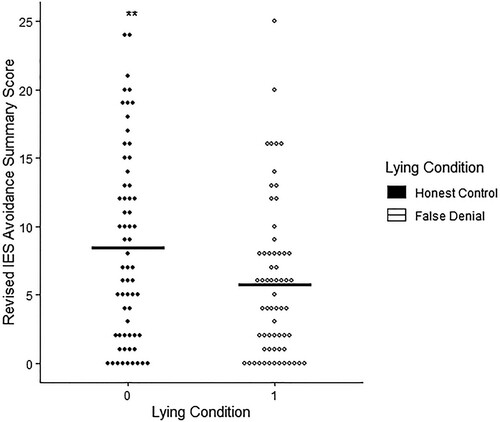
Figure 4. Summary IES avoidance scores by lying condition.
Note: Each dot represents one participant. Means are represented by bars. ** = p < 0.05.
Supplemental material
Supplemental Material
Download MS Word (220 KB)Data availability statement
The data supporting the results and analyses of this paper can be accessed on the Open Science Framework where the data has been deposited (https://osf.io/hcunq/?view_only=08769a6c41794a419243f3edab5f3d01).