Figures & data
Figure 1. Study design.
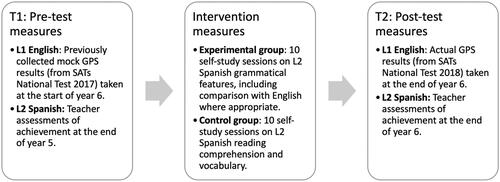
Figure 2. Worksheet on verbal Inflection and null subjects.
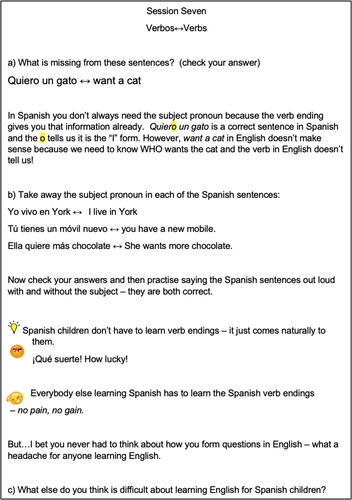
Figure 3. Worksheet from activity on adjectives, with answers.
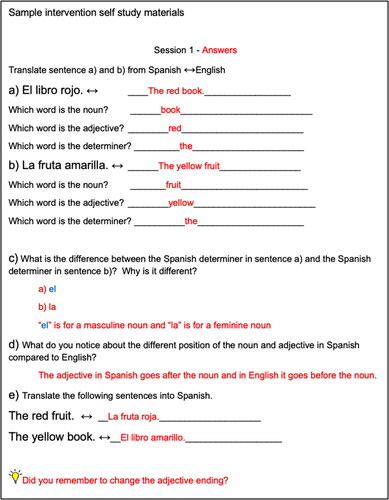
Figure 4. Boxplots showing children’s scores on the tests of spelling (above) and grammar (below) at pre- and post-test, separated by group (intervention/control).
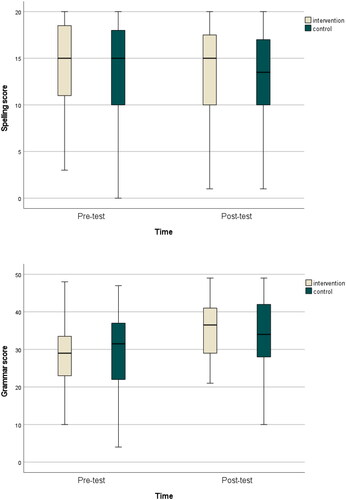
Table 1. Descriptive statistics (mean (standard deviation)) for GPS scores; median (range) for Spanish score) for pre- and post-test measures of L1 spelling and grammar and L2 skills, split by intervention group.
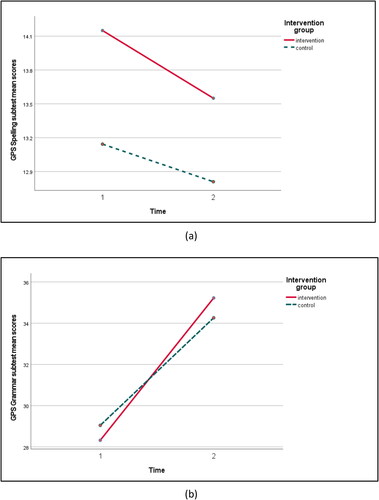
Figure 5. (a) Performance on GPS spelling subtest from pre-test to post-test by intervention group. (b) Performance on GPS grammar subtest from pre-test to post-test by intervention group.