Figures & data
Figure 1. Source: Adapted from www.levada.ru, last accessed 8 April 2008. Figures show the distribution of voting preferences among those who said they intended to vote, in rounded percentages (the November figures are for 23–27 November, beyond which survey forecasts could not be reported), and the vote itself on 2 December. CPRF = Communist Party of the Russian Federation; LDPR = Liberal-Democratic Party of Russia; URF = Union of Right Forces.
FIGURE 1. Party Preferences among Intending Voters, January–November 2007
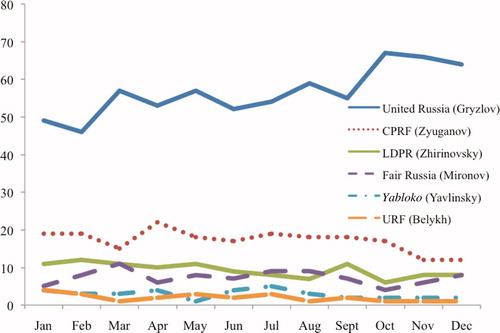
TABLE 1
Russian
Duma
Elections, 1993–2007
TABLE 2
The
Duma
Election Result, 2 December 2007
TABLE 3
The Turnover of the
Duma
Vote, 2003–2007
Figure 2. Figures show the percentage saying the economy is ‘very good’ or good’ minus the percentage saying ‘bad’ or ‘very bad’.
Sources: The figures for January 1995–January 2007 are derived from Vestnik obshchestvennogo mneniya, 1, 87, January–February 2007, and for January–November 2007 from Vestnik obshchestvennogo mneniya, 6, 92, November–December 2007.
FIGURE 2. Trends in Perceptions of Economic Performance
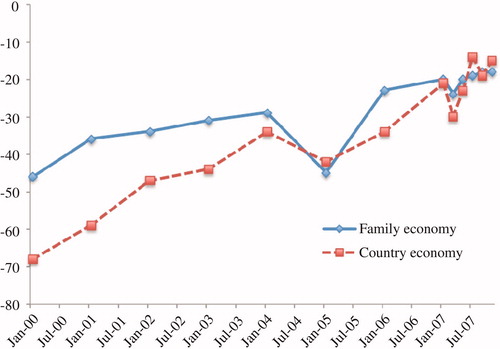
TABLE 4
The Economy and the Vote
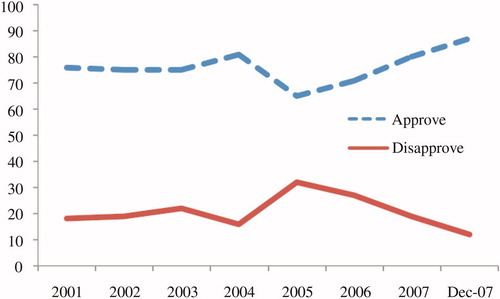
Figure 3. Annual figures from January each year. Source: Adapted from http://www.russiavotes.org/president/putin_performance_trends.php, accessed 19 April 2008.
FIGURE 3. Evaluations of Putin's Performance as President