
Figures & data
FIGURE 1. Local Income of Municipalities (HUF Billion) and VFI (%)
Source: Hungarian Central Statistics Office (Citation2022b).
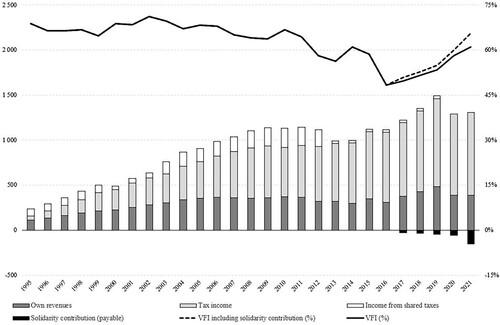
FIGURE 2. Settlements in SMDs, 2014
Source: National Election Office (Citation2022).
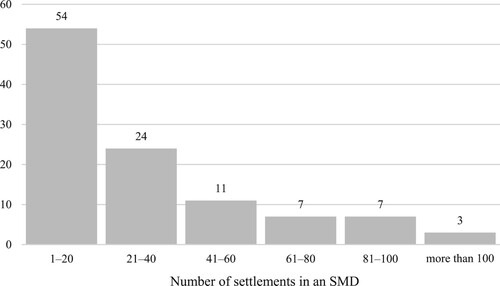
TABLE 1 Local Government Characteristics According to Political Alignment
TABLE 2 OLS Estimations for 2015–2018
FIGURE 3. RD Plots Applying Parametric and Non-parametric Estimations
Notes: Margin is measured on the x-axis, while log grant value per capita is measured on the y-axis. Red lines represent the predicted values of best fit global polynomial estimations (left hand side), and local linear estimation with optimal bandwidth (right hand side) based on Imbens and Kalyanaraman (Citation2012), applying triangular kernel and 20 intervals on both sides.
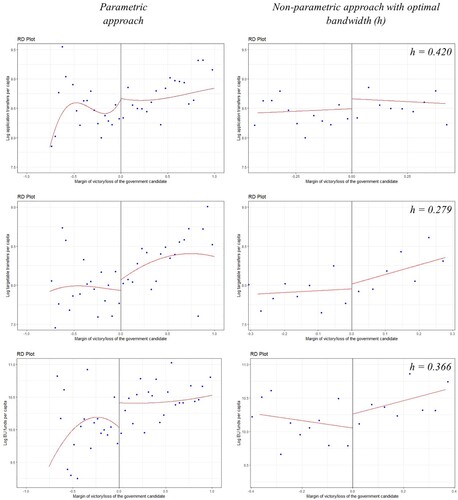
TABLE 3 RDD Estimations for 2015–2018
TABLE 4 Impact of Grants on Government Supporting Votes in the National Election of 2018
TABLE 5 Mapping of Grant Schemes to Channels of Pork-Barrelling