Figures & data
Figure 1. The role of attention in carbon label effectiveness.
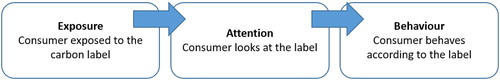
Figure 2. Carbon and local farmer labels.
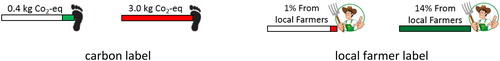
Table 1. Average dwell time for all areas of interests across three groups.
Table 2. Average dwell time for six labels in order of fixated labels.
Table 3. Number of times (%) each burger was chosen across experimental and control groups.
Table 4. Burger choice and attention to the carbon and local farmer labels.
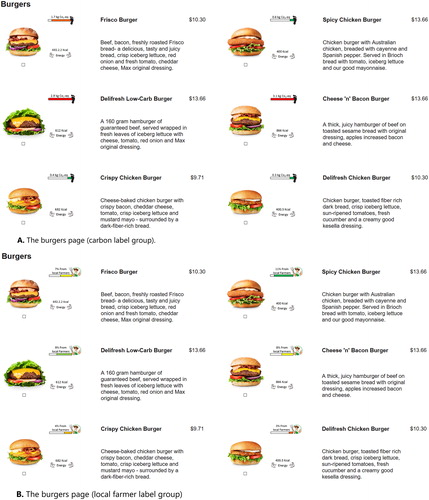
Figure A1. (A) The burgers page (carbon label group). (B) The burgers page (local farmer label group).