
Figures & data
Figure 1. Number of Instagram posts by kind.
Source: Instagram, accessed March 2020, and own calculations.
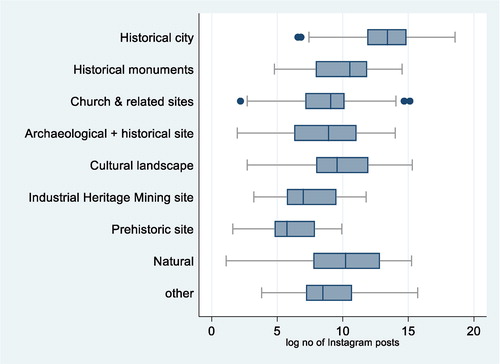
Figure 2. Average number of Instagram posts by site on the danger list.
Source: Instagram, accessed March 2020, and own calculations.
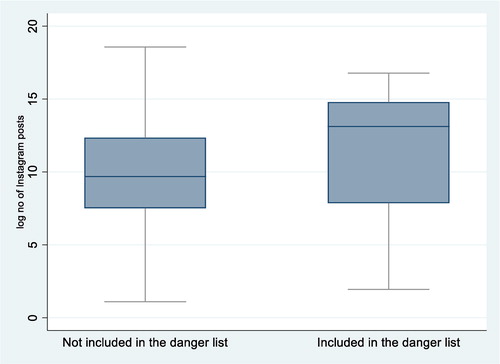
Figure 3. Average number of Instagram posts by country.
Notes: The left axis contains the ISO 2 country codes.
Source: Instagram, accessed March 2020, and own calculations.
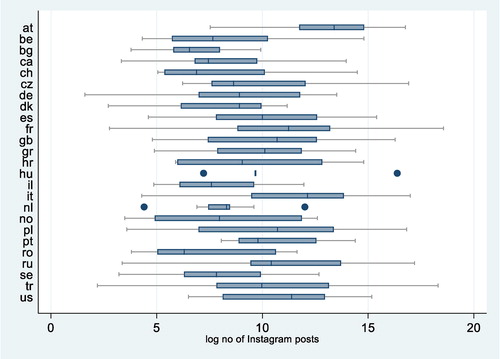
Figure 4. Average number of Instagram posts by criteria.
Source: Instagram, accessed March 2020, and own calculations.
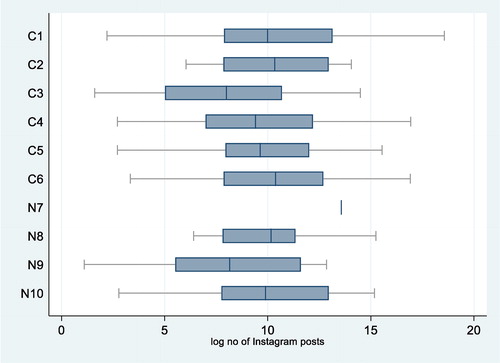
Table 1. Number of Instagram posts by type (top 5) (in 1000 s).
Figure 5. Relationship between the number of Instagram posts and years of inscription of the WHS.
Source: WHS database, Instagram, accessed March 2020, and own calculations.

Figure 6. Relationship between the number of Instagram posts and size by type.
Source: UNESCO World Heritage Site database and Instagram.
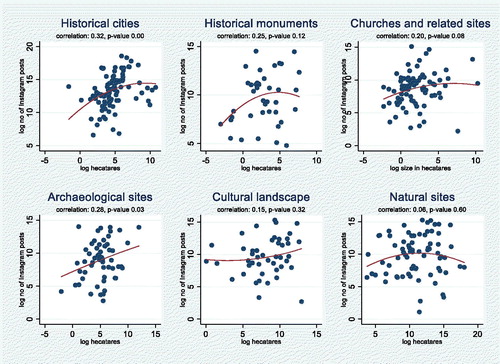
Figure 7. Relationship between the number of Instagram posts and size.
Notes: The predicted logarithm of Instagram posts is calculated using the delta method using the estimates for size and size squared in specification (i) shown in .
Source: Instagram, accessed March 2020, and own calculations.
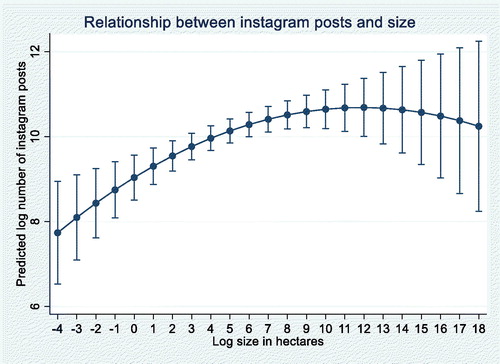
Table 2. Descriptive statistics.
Table 3. Determinants of the number of Instagram posts of World Heritage Sites.