
Figures & data
Figure 1. Potential and realised capacity in the use of sustainability indicators for policy making.
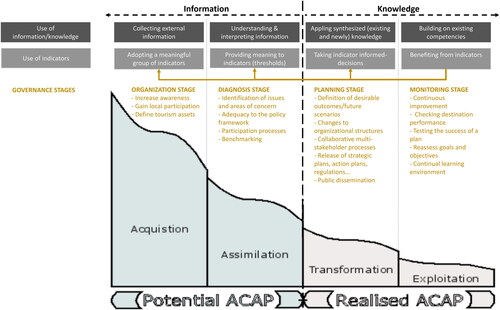
Table 1. ETIS. Conclusions from each implementation step. Source: Adapted from Romagosa and Sirse (Citation2016).
Figure 2. ETIS-related publications over time.
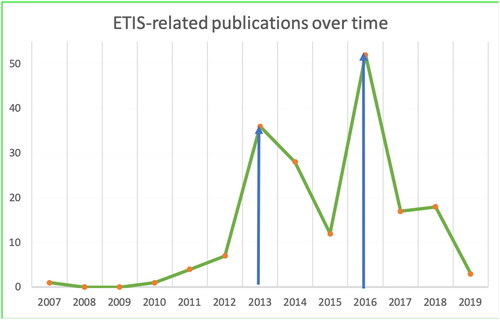
Table 2. ACAP. Evidence collected from the case studies.
Table 3. The design of sustainable tourism indicators.
Table 4. The use of sustainable tourism indicators.