Figures & data
Figure 1. Lorenz curve and Gini coefficient.
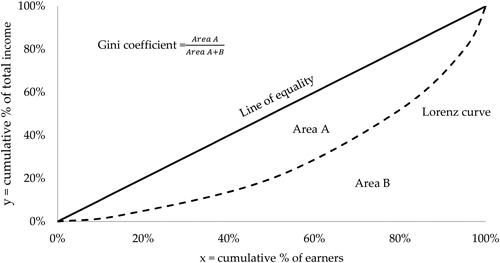
Table 1. Percentage changes of employment multipliers to previous year.
Figure 2. Sectoral employment effects.
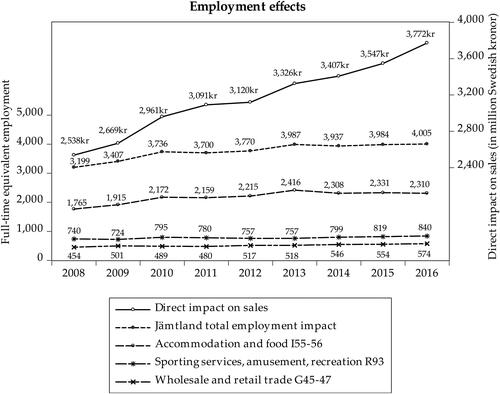
Figure 3. Lorenz curves of tourism-related sectors.
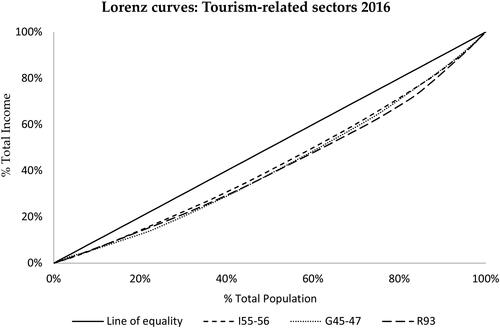
Figure 4. Gini coefficients for tourism-related sectors.
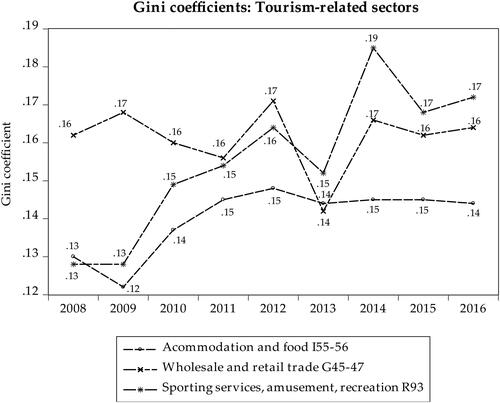
Figure 5. Top and bottom income earners in the accommodation and food sector.
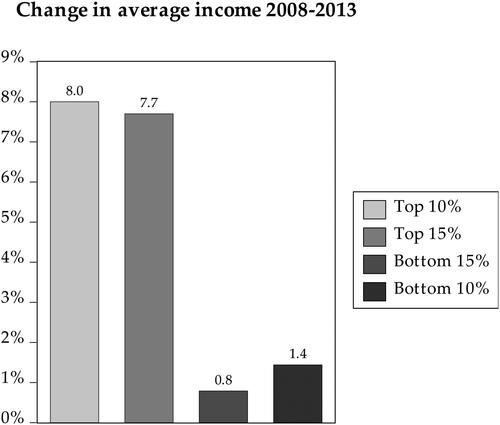
Table 2. Occupational areas in the accommodation and food sector.
Figure 6. Employment and income effects per occupational area.
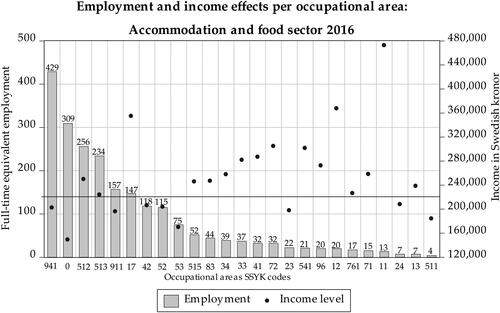
Figure 7. Occupations with and without required higher education.
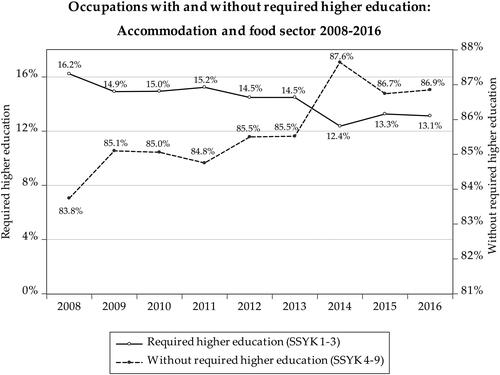
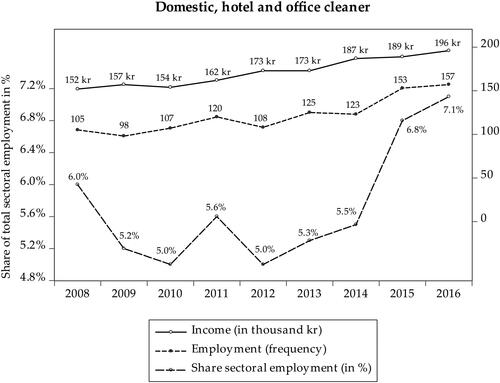
Figure 8. Employment and income effects for domestic, hotel and office cleaner (SSYK 911).