
Figures & data
Table 1. Demographics of participants (n = 924).
Table 2. Binary Logistic regressions examining the predictive value of control variables (Model 1) and the additional value of adding perceptions of last chance tourism, identity with nature and first visit (Model 2) on likelihood to make a new donation during and/or after a travel experience.
Figure 1. Making tourism count for conservation. A tour operator guide to encouraging tourists to give to charity.
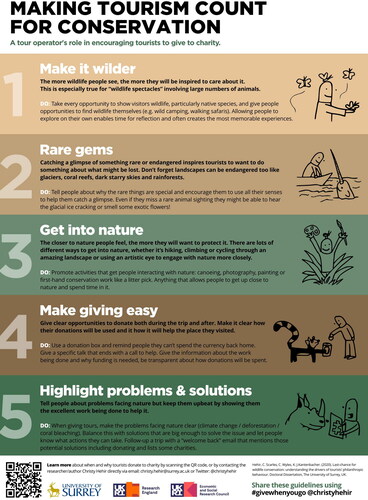
Table A1. Last chance tourism scale items.
Table A2. Table with correlations between the variables used in the regression.