
Figures & data
Table 1. Table of the percentage of guest nights at commercial accommodation establishments allocated to air travel, data adapted from Naess-Schmidt et al. (Citation2019).
Figure 1. Number of international round trips by non-residents and Swedish residents (data based on Kamb and Larsson (Citation2019) and from Transport Analysis (Citation2020)).
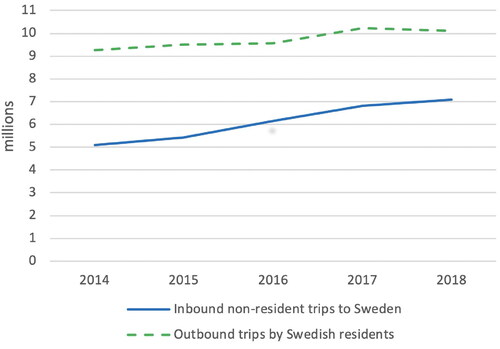
Figure 2. Calculated average round trip distance by non-residents in kilometres, compared to outbound trips by Swedish residents with data based on Kamb and Larsson (Citation2019).
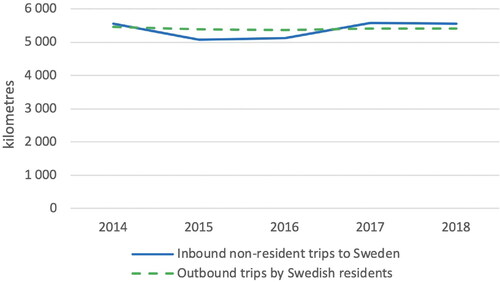
Figure 3. Calculated Swedish-adjusted global kg CO2 per pkm and kg CO2eq per pkm including the non-CO2 effects with an EWF at 1.7 (Lee et al., 2021), adjusted for Sweden.
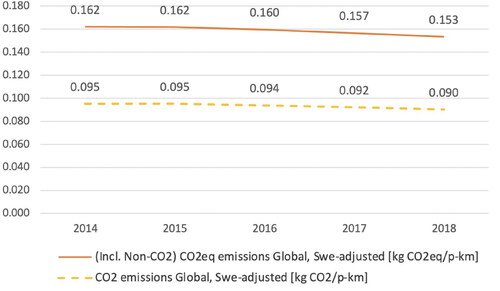
Figure 4. Calculated total climate impact in Mt CO2eq from inbound trips by non-residents, compared with outbound international trips by Swedish residents (data based on Kamb and Larsson (Citation2019)).
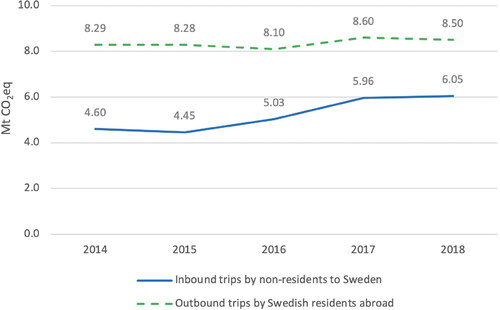
Table 2. UNWTO data of total arrivals from air travel at establishments, and calculated total arrivals.
Table 3. Average one-way distance calculated from UNWTO arrival data (origin of tourists, UNWTO 2019) at establishments compared to only using the direct arrival countries without transit data from Swedavia (Swedavia, Citation2020).