
Figures & data
Figure 1. Total Contribution of Tourism to GDPs and Employment in Europe in 2019.
Data source: WTTC, Citation2021 (detailed data see in the Appendix)
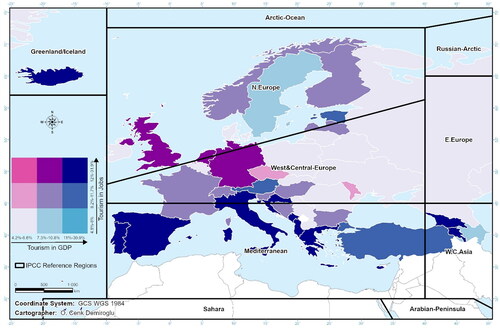
Table 1. Description of Klein et al. (Citation2017) four generations of adaptation research and examples of reviewed papers.
Figure 2. Research coverage on climate and carbon risks of tourism in Europe.
For detailed data, see in the Appendix
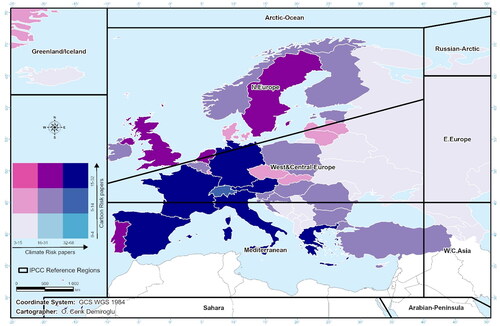
Table A1. Contribution of tourism to GDP and number of reviewed papers.