Figures & data
Figure 1. The variation in tourism CO2 emissions for uncertainty in demographic, economic and technological background. The model was run 5000 times following a Monte Carlo distribution for the inputs listed in the text.
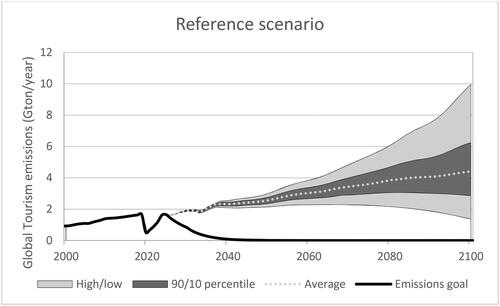
Figure 2. The BAU emission projections strongly contrast with the Emissions goal pathway shown by the black line. Notes: (1) The emissions for “other” transport are very small.
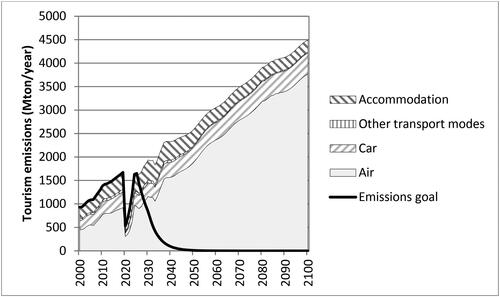
Figure 3. The impacts of various off-setting assumptions on aviation emissions. Notes about effects of varying assumptions for offsetting (see Section 1.5 of the Supplementary File for background information):
- Reference (1.5 °C): no offsets.
- CORSIA, ICAO assumptions: CORSIA share of aviation (domestic excluded), 100% effectiveness of off-sets, unlimited off-set resources.
- CORSIA with limited credits: CORSIA share of aviation, 100% effectiveness of off-sets, maximum of 30% share of available off-sets for aviation.
- CORSIA realistic: CORSIA share of aviation, 20% effectiveness and 30% share of available off-sets for aviation.
- Most optimistic off-setting assumptions: 100% aviation emissions, 100% effectiveness of off-sets, 100% share of available off-sets for aviation.
- Technically realistic off-setting assumptions: 100% aviation emissions, 20% offset effectiveness and 30% share of global available off-sets for aviation.
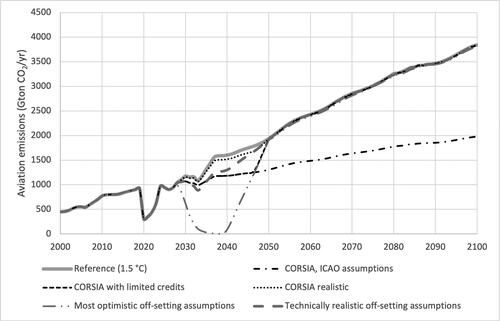
Figure 4. The potential of sustainable aviation fuels (SAF) for various assumptions about types and land-use and renewables constraints. The 1.5 °C refers to a background scenario where the global temperature is limited to 1.5 °C and the carbon cost and amount of renewable energy globally available in such a scenario.
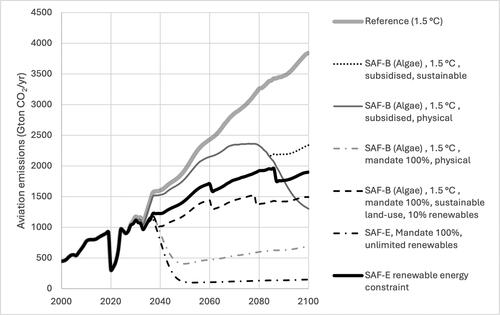
Figure 5. The potential for revolutionary technology in aviation for short-, medium-, and long-haul range aircraft, and all three combined (technology scenario). The fleet replacement case shows the theoretical emissions when zero emissions aircraft would come onto the market for all ranges by 2025. The “Reference (1.5 °C)” refers to the background that limits the global temperature rise to 1.5 °C.
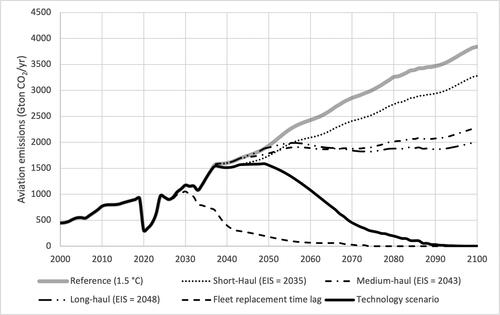
Figure 6. The impact of the isolated policy categories and some combinations. The “Reference (1.5 °C)” refers to a global background scenario that limits the global temperature to 1.5 °C, while the other reference scenario assumes the temperature is allowed to rise to 3.3 °C. The main difference for the tourism system is in the different carbon cost in these two background scenarios.
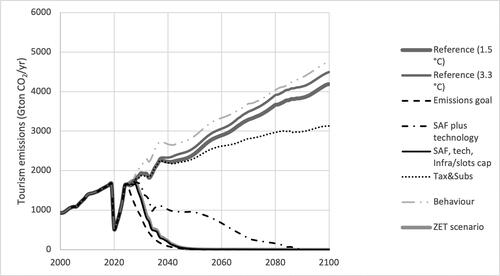
Table 1. Overview of all assumptions of the ZET scenario that deviate from the Reference Scenario.
Figure 7. The final ZET scenario emissions per main tourism subsector.
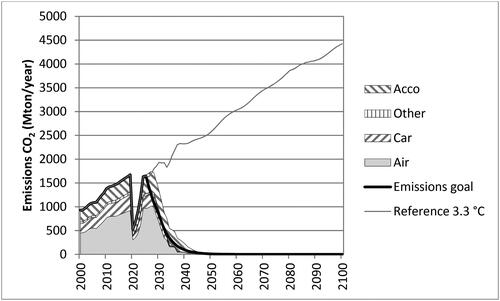
Figure 8. The impacts of the ZET scenario on the number of trips (upper left), kilometres travelled (upper right), revenues (lower-left and guest nights (lower right).
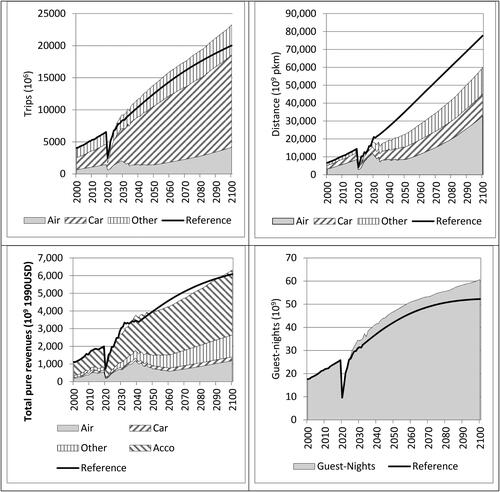
Figure 9. Market distribution graphs (billion trips; Mton CO2 (upper-right)) as a function of distance class (lower and upper bounds shown in kms one-way on the horizontal axis).
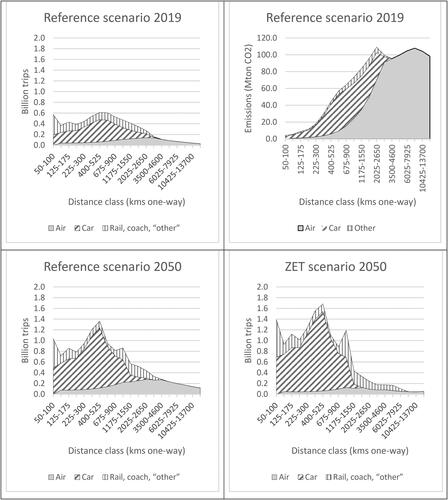
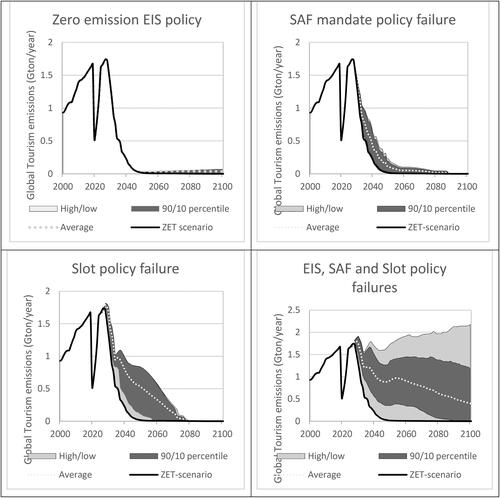
Figure 10. The impact of policy failure on all tourism emissions for the failure of bringing zero emissions aircraft to the market (EIS delayed, upper left), a failure to implement the SAF-E blending mandate (upper right) and a failure of the slot capacity policy (lower left). The lower right figure shows the impact of all three failures concurrently.