Figures & data
Fig. 1. Vertical irradiance distribution in microcosms under HE (square), ME (diamond) and LE (circle) conditions. The depressed irradiance at the surface of the HE and ME conditions is due to some shading from the top edge of the microcosm.
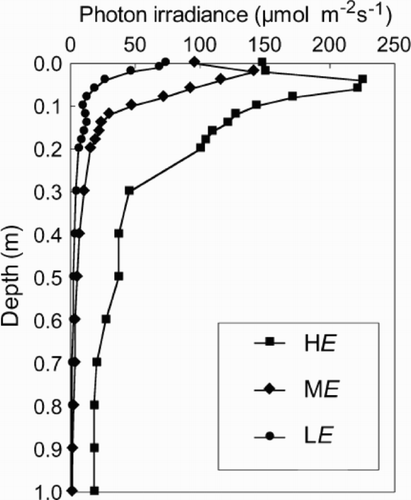
Table 1 . Summary of light conditions inside the microcosms in each of the three irradiance treatments. Data are the mean irradiance through the column depth, and the vertical light attenuation coefficient (K d) determined over the first 0.3 m and the whole column (1 m)
Fig. 2. Growth rate of Anabaena circinalis versus irradiance at 20°C and 16 : 8 L : D. Curves for Monod (broken line) and the exponential functions (solid line) are fitted to the growth data.
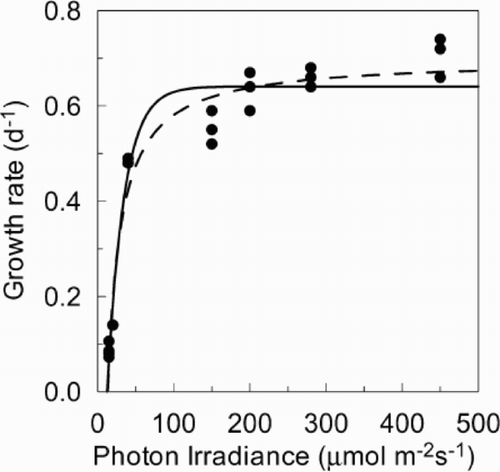
Fig. 3. Chlorophyll a and carbon content of Anabaena circinalis grown in 16:8h L : D cycles at 20°C. (A) chlorophyll a quota, (B) carbon quota, and (C) chl a : C ratio vs irradiance; (D) chl a : C ratio vs growth rate. Samples were taken at 12:00 h to avoid diurnal variation in pigment content.
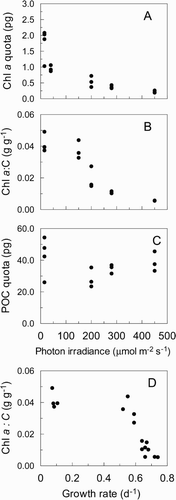
Fig. 4. Flotation rate of Anabaena circinalis versus irradiance in 16:8 h L:D cycles at 20°C. Data points are means of three replicate cultures, and error bars are ± 1 S.D.
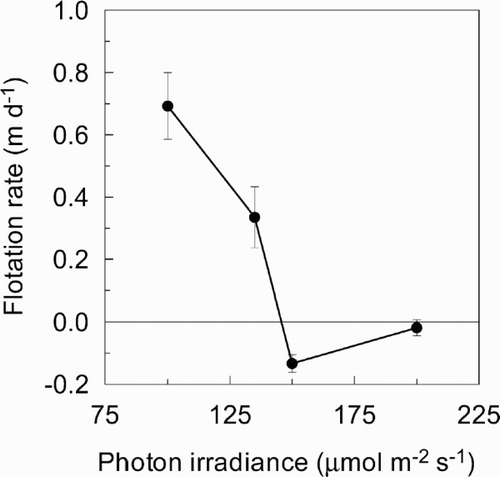
Fig. 5. Growth rates of Anabaena circinalis in microcosms under 10 min (MIXED) and 48 h (CALM) mixing regimes as light was sequentially reduced (HE→ME→LE). The L : D cycle was 16 : 8 h and temperature 20°C. Data points are means of three replicate cultures, and error bars are ± 1 S.D.
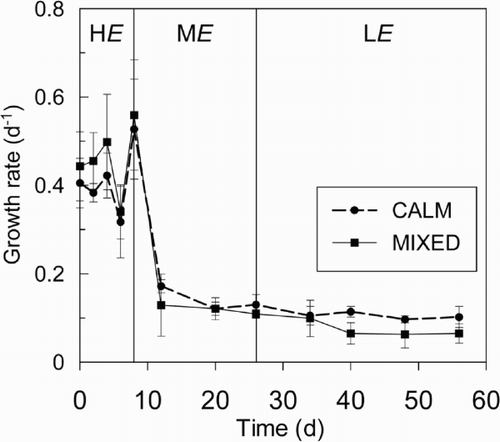
Fig. 6. Physiological measurements of Anabaena circinalis from the microcosm experiment for three irradiance treatments. (A) chlorophyll a quota (n: HE = 12, ME = 6, LE = 9), (B) carbon quota (n: HE = 9, ME = 6, LE = 9) (C) chl a : carbon ratio (n: HE = 9, ME = 6, LE = 9), (D) carbohydrate quota (n: HE = 12, ME = 6, LE = 3), (E) chl a : carbohydrate ratio (n: HE = 12, ME = 6, LE = 3), and (F) flotation rate (n = 3). Individual t-test comparisons of mixing regimes (MIXED and CALM) were performed for each irradiance treatment, and significant differences indicated with an asterisk. Photoperiod and temperature were 16 : 8 h L : D and 20°C, respectively. Error bars are ± 1 S.D.
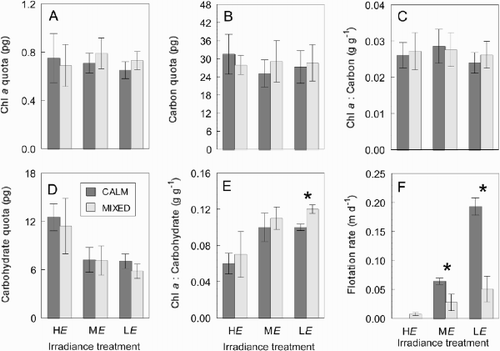
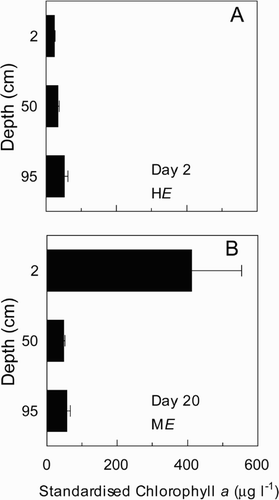
Fig. 7. Depth distribution of chlorophyll a in microcosms of Anabaena circinalis grown under (A) HE conditions on day 2 and (B) ME conditions on day 20. Data points are means of thee replicate cultures, and error bars are ± 1 S.D.