Figures & data
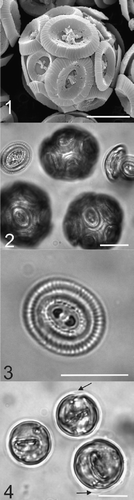
Figs. 1–4. Micrographs of Coccolithus pelagicus. . SEM image of a whole C. pelagicus cell (182g strain) showing coccolith morphology consistent with the temperate sub-species braarudii. . Light micrograph of C. pelagicus showing complete coccospheres and loose coccoliths, which were also present in the cell suspension. . Light micrograph showing detail of the distal shield and central bar of the coccoliths produced by C. pelagicus 182g. . EGTA-decalcified cells showing internal coccoliths at various stages of development and in two cells there is evidence of the loose periplasmic organic layer of scales (black arrows, see also ). Scale bars: 10 µm.
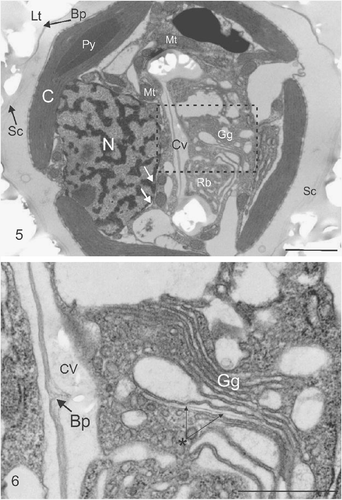
Figs. 5, 6. Ultrastructure of coccolith developing within a C. pelagicus cell. . TEM showing impression left by external coccoliths (Lt), baseplate of coccolith (Bp) and layer of organic scales (Sc) on the outside of the cell. Internal organelles comprise the chloroplast (C) showing a single thylakoid traversing the pyrenoid (Py), Nucleus (N) surrounded by the nuclear envelope, indicated by white arrows, and mitochondria (Mt), closely associated Golgi-derived coccolith vesicle (Cv) in the early stages of development. The Golgi body (Gg) and mass of anastomosing vesicles resembling a reticular body (Rb) are located in the distal pocket of the developing coccolith vesicle. . Detail of (indicated by box) showing the Golgi body and the central region of the coccolith vesicle containing an unmineralized section of the coccolith organic baseplate. A newly developing organic baseplate or scale is located within a distal Golgi cisterna (marked with asterisk). Scale bars: 2 µm () and 1 µm ().
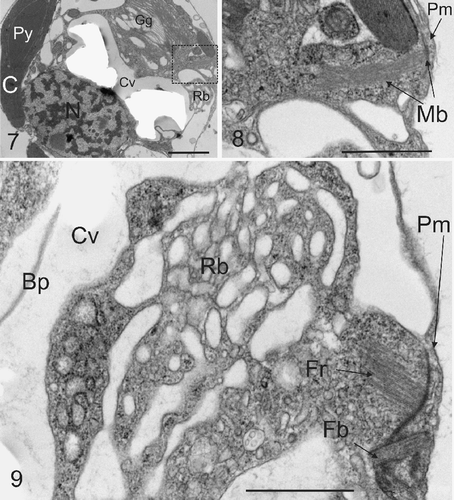
Figs. 7–9. Microtubule bundles and flagellar root. . TEM section showing the typical location of microtubule bundles with respect to coccolith vesicle and the reticular mass (Rb). Abbreviations are as in legend for . . Detail from box in showing bundle of microtubules (Mb) projecting from the plasma membrane (Pm) into the interior of the cell. This structure resembles a root of a flagellar apparatus as described below. . A further TEM section showing the detail of a section through a compound flagellar root, in proximity with the reticular mass. A flagellar base (Fb) can be seen associated with microtubular flagellar roots (Fr). Other abbreviations are as . Scale bars: 1 µm.
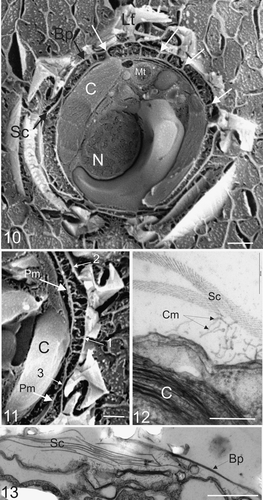
Figs. 10–13. External and internal morphology of C. pelagicus using freeze fracture SEM and TEM. . Freeze fracture through the centre of a whole C. pelagicus cell showing fractured external interlocking coccoliths (Lt) with baseplate (Bp), layer of organic scales (Sc) connected to the plasma membrane by columnar strands and local adhesions spanning the periplasmic space (examples indicated with white arrows). The nucleus (N), Chloroplast (C) and mitochondria (Mt) are also easily distinguished. . Detail of a further freeze-fracture showing columnar strands forming attachments between the plasma membrane (Pm) and both the coccolith baseplate (1) and organic scales (2). Occasional close associations between the layer of organic scales and plasma membrane are observed (3). . TEM showing detail of columnar strands (Cm) connecting the plasma membrane to organic scales (Sc). The chloroplast (C) is clearly visible. . TEM section at the surface of cell showing organic scales interspersed between coccolith baseplates. Scale bars: 2 µm (), 1 µm (), 200 nm () and 1 µm ().
Figs. 14–18. Typical ultrastructural sequence of coccolith formation in C. pelagicus. . Newly forming coccoliths with rim of calcite deposit. The coccolith vesicle (Cv) is closely associated with the nucleus (N). Reticular (Rb) and Golgi bodies (Gg) are located in the distal pocket of the coccolith vesicle. . A mature coccolith within a vesicle that remains closely associated with the nucleus. . A mature coccolith vesicle disassociating from the nucleus prior to release. Again, the Golgi body and reticular mass are clearly located in the distal pocket formed by the coccolith vesicle. . A mature coccolith at the surface of the cell shortly after vesicle fusion. Note the proximal coccolith vesicle (Cv). membrane is intact and the distal coccolith vesicle membrane is no longer present. The coccolith has not emerged through the layer of scales (Sc) below the external layer of coccoliths (Lt) in this section. Scale bars: 2 µm.
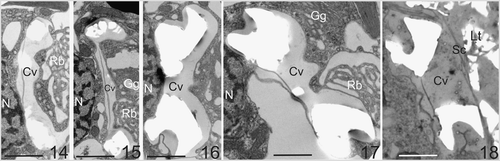
Fig. 19. Time-lapse video analysis of coccolith secretion. Bright field images of a decalcified C. pelagicus cell with mature internal coccolith taken every 30 s (time in seconds indicated on each panel) during a coccolith secretion event. The coccolith initially emerges tangentially (0–60 s) followed by a curved trajectory (90–180 s) before lying flat on the cell surface. The secretion event is accompanied by considerable contractile activity of the protoplast (e.g. 120 s), see also . Scale bars: 10 µm, time indicated is s.
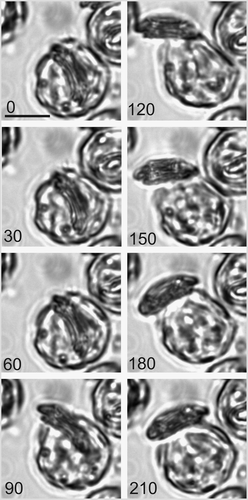
Fig. 20. Location of coccolith secretion. Time-lapse images of a second coccolith secreted by a cell after decalcification. The sequence shows a cell with one previously secreted coccolith. The cell rotated approximately 90° with respect to the first coccolith before secretion of the second coccolith. The second coccolith emerged in a 60 s period (30–90 s) followed by contractile activity that ‘pushes’ the coccolith away from the cell. Formation of the third coccolith can be detected within 60 s of coccolith secretion (indicated by arrow at 150 s). Scale bar: 10 µm.
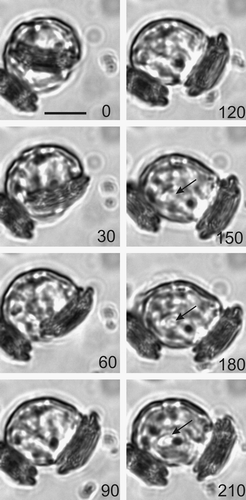
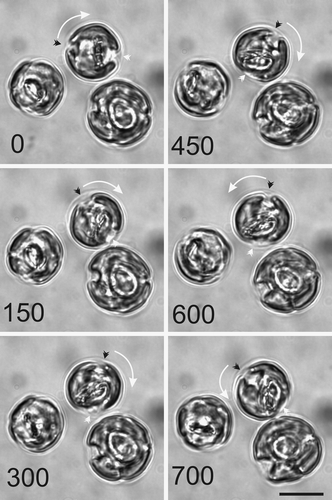
Fig. 21. Cell motion during coccolith development. A series of light micrographs acquired in sequence illustrate the rotary motility typically exhibited by actively calcifying C. pelagicus cells. The anterior-posterior axis of the uppermost cell is marked by a black and a white arrowhead. This axis has rotated first clockwise (0–450 s) followed by an anticlockwise movement (450–700 s). The direction of rotation is shown with a white arrow. The other cells in this field are also exhibiting movement with respect to their fixed position on the microscope slide. Scale bars: 10 µm.
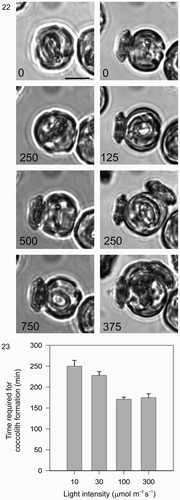
Figs. 22, 23. Light dependency of coccolith formation. . A single cell was monitored after decalcification. First, in the dark (0–750 min) followed by a period in the light (0–375 min, 100 µmol m−2 s−1). During the dark period, a secretion event of an existing mature coccolith occurred followed by the initiation of a new coccolith that developed only very slowly and which was not secreted during the first 750 min recording period. During the subsequent 375 min light period, the cell rapidly completed the formation and secretion of three coccoliths. Note the location of the second coccolith (250 min), which reflects the fact that the cell rotated approximately 90° with respect to the first coccolith before secreting. The third coccolith was secreted between the first and second. Cell size increased noticeably in the light compared to the dark. Scale bar: 10 µm. . Graphical representation of the effect of light on coccolith formation in C. pelagicus. Each bar represents the average time (±SE) of coccolithogenesis from a minimum of 20 cells at each light level, the experiment was repeated at least three times for each light treatment.