3,449
Views
28
CrossRef citations to date
0
Altmetric
Articles

Isolation, characterization and localization of extracellular polymeric substances from the cyanobacterium Arthrospira platensis strain MMG-9

, , , &
Pages 143-150 | Received 28 Jul 2013, Accepted 13 Jan 2014, Published online: 25 Apr 2014

Figures & data

Table 1. Fluorescent dyes and conditions.

Table 2. Biochemical characteristics of EPS fractions.

Table 3. Comparison of constituent monosaccharidic residues in different EPS fractions of A. platensis MMG-9.

Figs 1–9. Localization of EPS from A. platensis MMG-9 using confocal laser scanning microscopy. Figs 1, 3. Overlaid images of autofluorescence and stained EPS with DTAF. Figs 2, 4. Spiral trichomes embedded in EPS stained with DTAF. Figs 5–6. Overlaid images of autofluorescence and stained EPS with CSA-TRITC. Fig. 7. Image of EPS stained with CSA-TRITC. Fig. 8. Staining with Con-A-FITC. Fig. 9. Staining with Alexa Fluor 488. Scale bars = 10 µm (Figs 1, 2), 15 µm (Figs 3, 4), 5 µm (Fig. 5), 10 µm (Figs 6–9). Red = cyanobacterial autofluorescence, green = EPS.
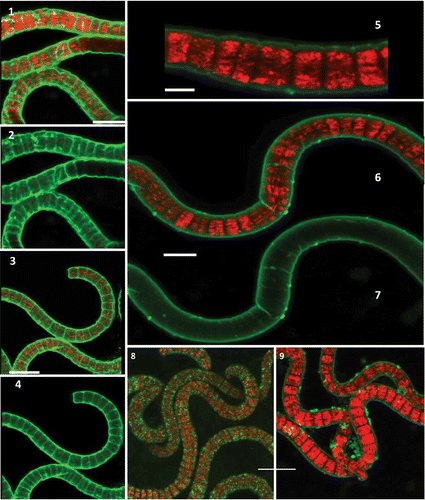
Figs 1–9. Localization of EPS from A. platensis MMG-9 using confocal laser scanning microscopy. Figs 1, 3. Overlaid images of autofluorescence and stained EPS with DTAF. Figs 2, 4. Spiral trichomes embedded in EPS stained with DTAF. Figs 5–6. Overlaid images of autofluorescence and stained EPS with CSA-TRITC. Fig. 7. Image of EPS stained with CSA-TRITC. Fig. 8. Staining with Con-A-FITC. Fig. 9. Staining with Alexa Fluor 488. Scale bars = 10 µm (Figs 1, 2), 15 µm (Figs 3, 4), 5 µm (Fig. 5), 10 µm (Figs 6–9). Red = cyanobacterial autofluorescence, green = EPS.

Figs 10–14. Localization of EPS from A. platensis MMG-9 using confocal laser scanning microscopy. Figs 10–12. Spiral filaments embedded in EPS stained with Lotus-FITC. Fig. 13. EPS clouds from A. platensis MMG-9 using confocal laser scanning microscopy and three dyes (Lotus-FITC, CSA-TRITC and Alexa Fluor 488). Fig. 14. z-stacks showing the depth of the image (numbers show depth in µm). Scale bars = 15 µm (Fig. 10), 10 µm (Fig. 11), 50 µm (Fig. 12), 10 µm (Fig. 13). Red = cyanobacterial autofluorescence, green = EPS.
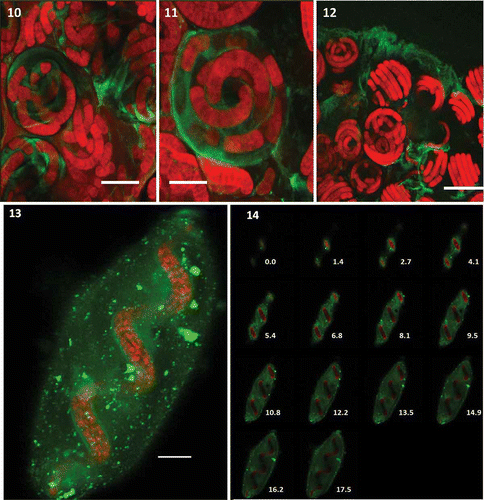
Figs 10–14. Localization of EPS from A. platensis MMG-9 using confocal laser scanning microscopy. Figs 10–12. Spiral filaments embedded in EPS stained with Lotus-FITC. Fig. 13. EPS clouds from A. platensis MMG-9 using confocal laser scanning microscopy and three dyes (Lotus-FITC, CSA-TRITC and Alexa Fluor 488). Fig. 14. z-stacks showing the depth of the image (numbers show depth in µm). Scale bars = 15 µm (Fig. 10), 10 µm (Fig. 11), 50 µm (Fig. 12), 10 µm (Fig. 13). Red = cyanobacterial autofluorescence, green = EPS.

Reprints and Corporate Permissions

Please note: Selecting permissions does not provide access to the full text of the article, please see our help page How do I view content?

To request a reprint or corporate permissions for this article, please click on the relevant link below:

Academic Permissions

Please note: Selecting permissions does not provide access to the full text of the article, please see our help page How do I view content?

Obtain permissions instantly via Rightslink by clicking on the button below:

If you are unable to obtain permissions via Rightslink, please complete and submit this Permissions form. For more information, please visit our Permissions help page.