Figures & data
Fig. 1. Apical segments of Gracilaria birdiae from the red (RDCE and RDES), green (GRCE) and greenish-brown (GBCE) strains, after 28 days of exposure to: photosynthetically active radiation, PAR (control); and PAR+UV-B (0.08 W m–2). A, RDCE. B, RDES. C, GRCE. D, GBCE. Scale = 1 cm.
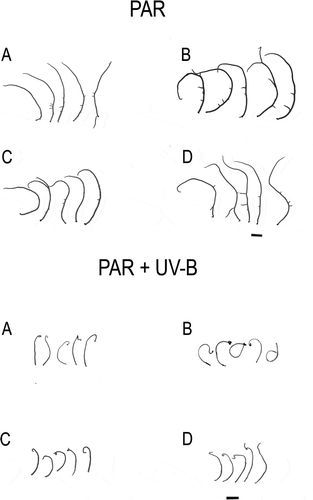
Fig. 2. Relative growth rates from red (RDCE and RDES), green (GRCE) and greenish-brown (GBCE) strains of Gracilaria birdiae cultivated in different conditions showing all data collected over 28 days. Samples exposed to: photosynthetically active radiation, PAR (control), P; and PAR+UV-B (0.08 W m–2), PB. Data presented as mean ± SD (N = 3). Treatments with different letters indicate significant differences according to one-way ANOVA and Newman–Keuls test (P <0.05).
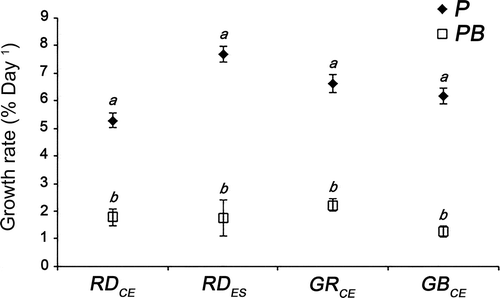
Fig. 3. Growth rates of strains of Gracilaria birdiae calculated from the average of fresh mass (mg) obtained every week for 28 days. Samples exposed to: photosynthetically active radiation, PAR (control), P; and PAR+UV-B (0.08 W m–2), PB. Data presented as mean ± SD (N = 3). Treatments with different letters indicate significant differences according to one-way ANOVA and Newman–Keuls test (P < 0.05).
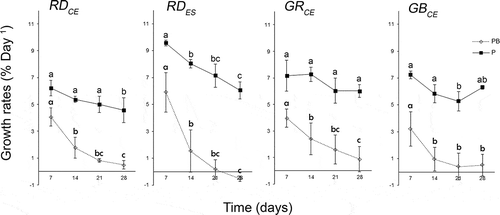
Fig. 4. Phycobiliprotein concentrations of four strains of Gracilaria birdiae. Data were obtained from algae cultivated in different conditions: photosynthetically active radiation, PAR (control), P and PAR+UV-B (0.08 W m–2), PB. APC, allophycocyanin; PC, phycocyanin; PE, phycoerythrin. Data presented as mean ± SD (N = 3). Treatments with different letters indicate significant differences according to one-way ANOVA and Newman–Keuls test (P < 0.05).
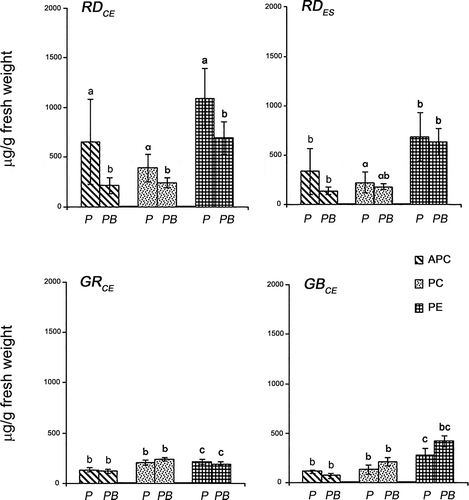
Fig. 5. Ratios of phycobiliproteins in four strains of Gracilaria birdiae. Data were obtained from algae cultivated in different conditions: photosynthetically active radiation, PAR (control), P; and PAR+UV-B (0.08 W m–2), PB. (PE/PC, phycoerythrin/phycocyanin; PE/APC, phycoerythrin/allophycocyanin; PC/APC, phycocyanin/allophycocyanin. Data presented as mean ± SD (N = 3). Treatments with different letters indicate significant differences according to one-way ANOVA and Newman–Keuls test (P < 0.05).
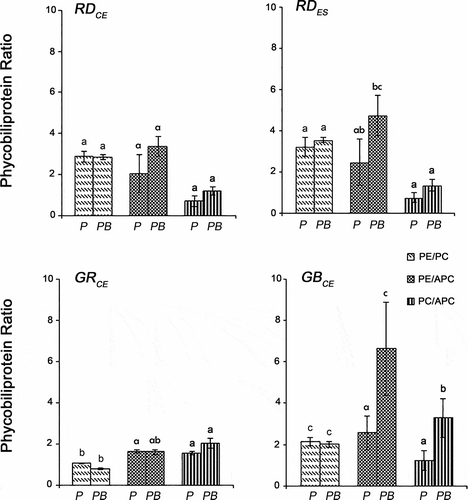
Fig. 6. Chlorophyll a (Chl a) and carotenoid (Car) concentrations of four strains of G birdiae. Data were obtained from algae cultivated in different conditions: photosynthetically active radiation, PAR (control), P; and PAR+UV-B (0.08 Wm-2), PB. Data presented as mean ± SD (N = 3). Treatments with different letters indicate significant differences according to one-way ANOVA and Newman–Keuls test (P < 0.05).
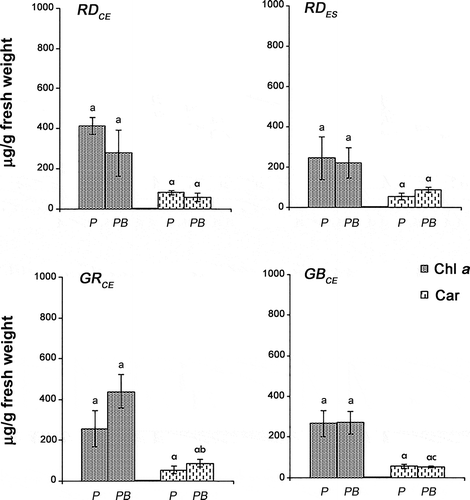
Fig. 7. Phycobiliproteins/chlorophyll a ratio in four strains of G. birdiae. Data were obtained from algae cultivated in different conditions: photosynthetically active radiation, PAR (control), P; and PAR+UV-B (0.08 W m–2), PB. APC/Chl a, allophycocyanin/chlorophyll a; PC/Chl a, phycocyanin/chlorophyll a; PE/Chl a, phycoerythrin/chlorophyll a. Data presented as mean ± SD (N = 3). Treatments with different letters indicate significant differences according to one-way ANOVA and Newman–Keuls test (P < 0.05).
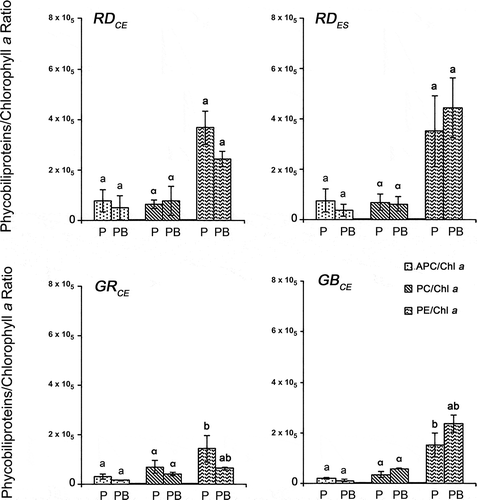
Fig. 8. Carotenoid/chlorophyll a ratio of four strains of G birdiae. Data were obtained from algae cultivated in different conditions: photosynthetically active radiation, PAR (control), P; and PAR+UV-B (0.08 W m–2), PB. Data presented as mean ± SD (N = 3). Treatments with different letters indicate significant differences according to one-way ANOVA and Newman–Keuls test (P < 0.05).
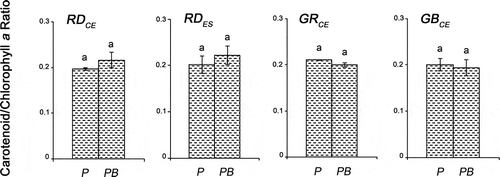
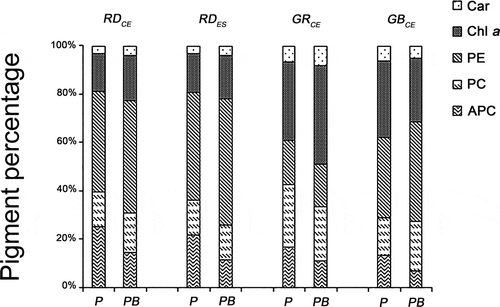
Fig. 9. Percentage of photosynthetic pigments present in four strains of G. birdiae. Data were obtained from algae cultivated in different conditions: photosynthetically active radiation, PAR (control), P; and PAR+UV-B (0.08 W m–2), PB. Car, carotenoids; Chl a, chlorophyll a; APC, allophycocyanin; PC, phycocyanin; PE, phycoerythrin.
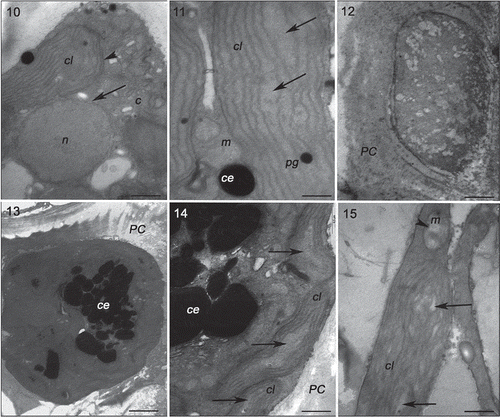
Figs 10–15. Transmission electron microscopy of the RDCE strain of Gracilaria birdiae. Figs 10, 11. Individuals exposed to PAR (control). Fig. 10. Nucleus surrounded by double membrane (arrow) and chloroplast with a single peripheral thylakoid (arrowhead); Fig. 11. Chloroplast with genophore (arrows). Figs 12–15. Individuals exposed to PAR+UV-B (0.08 W m–2) during 28 days (3 hours per day): cortical cells () and medullary cell (). Fig. 12. Disorganized cellular content; Fig. 13. Physodes in the cytoplasm; Fig. 14. Chloroplasts with separated thylakoids (arrows). Fig. 15. Chloroplast with separated thylakoids (arrows) associated with mitochondria with disintegrated cristae (arrowhead). Chloroplast (cl), Golgi bodies (c), physodes (ce), cell wall (PC), mitochondria (m), nucleus (n) and plastoglobuli (pg). Scale bars = 0.5 µm (); 2 µm ().
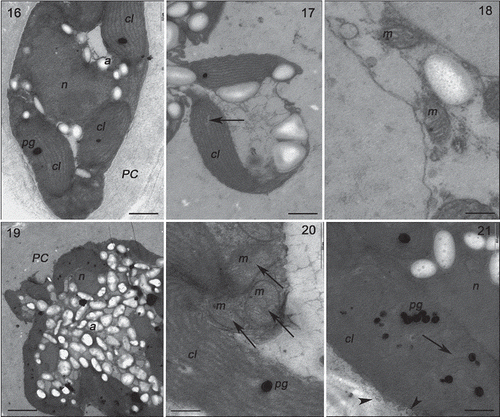
Figs 16–21. Transmission electron microscopy of the RDES strain of Gracilaria birdiae. Figs 16–18. Individuals exposed to PAR (control). Fig. 16. Cortical cell: chloroplasts arranged around the nucleus. Fig. 17. Chloroplast with genophore (arrow). Fig. 18. Detail of mitochondria. Figs 19–21. Cortical cells of individuals exposed to PAR+UV-B (0.08 W m–2) during 28 days (3 h per day). Fig. 19. Starch grains scattered on the cytoplasm. Fig. 20. Mitochondria with disintegrated cristae (arrows). Fig. 21. Cell wall-producing vesicles (arrowheads) and chloroplast with separated thylakoids (arrow). Chloroplast (cl), starch grain (a), mitochondria (m), nucleus (n), cell wall (PC) and plastoglobuli (pg). Scale bars = 0.5 µm (); 0.2 µm (); 2 µm ().
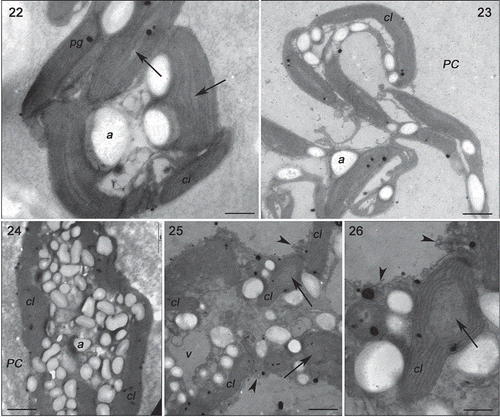
Figs 22–26. Transmission electron microscopy of the GRCE strain of Gracilaria birdiae. Figs 22–23. Individuals exposed to PAR (control). Fig. 22. Cortical cell: chloroplasts with genophore (arrows). Fig. 23. Medullary cells: chloroplasts with starch grains adjacent to the cell wall. Figs 24–26. Individuals exposed to PAR+UV-B (0.08 W m–2) during 28 days (3 h a day). Fig. 24. Cortical cell: Starch grains scattered on the cytoplasm. Fig. 25. Medullary cell: with irregular contours showing vesicle formation (arrowhead), organelle disorganization and separation of thylakoids in chloroplasts (arrows). Fig. 26. Chloroplast with separated thylakoids (arrow) and cell wall producing vesicles (arrowheads). Chloroplast (cl), cell wall (PC), plastoglobuli (pg), starch grains (a) and vacuole (v). Scale bars = 2 µm (); 0.5 µm ().
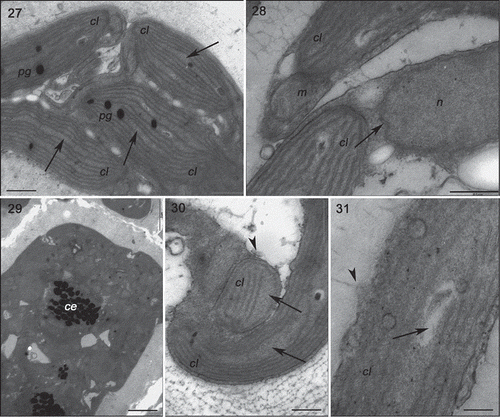
Figs 27–31. Transmission electron microscopy of the GBCE strain of Gracilaria birdiae. Figs 27–29. Individuals exposed to PAR (control). Fig. 27. Chloroplasts of cortical cell with genophore (arrows). Fig. 28. Medullary cells: note nuclear envelope (arrow). Fig. 29. Physodes in the cytoplasm of cortical cell. Figs 30–31. Medullary cells of individuals exposed to PAR+UV-B (0.08 W m–2) during 28 days (3 h per day). Fig. 30. Chloroplasts with separated thylakoids (arrows) and irregular contours (arrowhead). Fig. 31. Chloroplast with separated thylakoid (arrow) and cell wall-producing vesicles (arrowhead). Physodes (ce), chloroplast (cl), mitochondria (m), nucleus (n) and plastoglobuli (pg). Scale bars = 0.5 µm (); 2 µm (); 0.2 µm (Fig. 31).