Figures & data
Fig. 1. Schematic illustration showing the allocation of Fucus vesiculosus pieces (small rectangles) for a single replicate at one of 12 points in time. Induction aquaria contained 48 pieces (only 4 shown) at the beginning of the experiment from which 4 were allocated to feeding arenas (circles) or gene expression analysis at each of the 12 points in time. Stippled and solid lines indicate containers with and without grazers, respectively. Letters and numbers indicate ungrazed and grazer-exposed pieces of F. vesiculosus, respectively. Reconstituted food items (pentagons) used for feeding assays (subscript a) and corresponding autogenic controls (subscript b) were derived from the same previously grazed or ungrazed seaweed piece.
Fig. 2. Fucus vesiculosus consumption by Idotea baltica during 3 day intervals in the induction phase (n = 10). Data are shown as means and 95% confidence intervals (CI). Intervals at which CIs overlap with stippled line indicate times when consumption was not significantly different from the null hypothesis of no consumption. Intervals with non-overlapping CIs show significant differences in seaweed consumption. Arrows mark times when feeding assays suggest induction of anti-herbivory defences.
Table 1. Results of one-tailed paired t-tests comparing controls and previously grazed seaweed pieces. Consumption of consumers (Idotea baltica) was assessed in feeding assays using either fresh or reconstituted food pieces of Fucus vesiculosus (n = 10). Time = days after start of the induction phase. Day 0 to 27 = induction phase. Day 30 to 33 = reduction phase. Significant P values, i.e. α ≤ 0.05, in bold.
Fig. 3. Fucus vesiculosus consumption by Idotea baltica in two-choice feeding assays using fresh seaweed pieces. Mean ± SE (n = 10) isopod consumption of Fucus vesiculosus pieces that were previously grazed (dark grey bars) or were not exposed to grazing before (controls; light grey bars). Asterisks indicate significant results of one-tailed paired t-tests comparing distribution of differences between control and grazed pieces against the null-hypothesis of no difference.
Fig. 4. Fucus vesiculosus consumption by Idotea baltica in two-choice feeding assays using reconstituted food. Mean ± SE (n = 10) isopod consumption of food pellets made from Fucus vesiculosus pieces that were previously grazed (dark grey bars) or were not exposed to grazing before (controls; light grey bars). Interpretation of symbols as in .
Fig. 5. Number of responsive Fucus vesiculosus genes 15 and 18 days after onset of grazing. Differentially expressed genes were identified by microarray hybridizations and evaluated by two-way ANOVA combining biological replicates. Genes were considered to be differentially expressed when P values were < 0.01 and calculated fold changes were ≥ 1.5. Expression values of controls (i.e. control day 15 vs. day 0 and control day 18 vs. day 0) were subtracted from corresponding treatment values (i.e. treatment day 15 vs. day 0 and treatment day 18 vs. day 0) at each time point to obtain only grazing-related changes in gene expression. Genes that were differentially expressed between days 15 and 18 are also shown (T18 vs. T15). T18 vs. T15 fold changes were calculated by dividing the values of T18 vs. T0 by the values of T15 vs. T0. T0 = start of induction phase; T15 and T18 = grazed F. vesiculosus 15 and 18 days after start of induction phase, respectively. Overlaps display the numbers of genes regulated at multiple points in time. ↑ = up-regulated, ↓ = down-regulated.
Fig. 6. KOG category distributions of differentially expressed genes as identified by microarray hybridizations. Colour intensity corresponds to the number of genes per group, calculated as percentage of all regulated genes. The category ‘Metabolism’ includes amino acid, carbohydrate, lipid and nucleotide transport and metabolism. Identification of differentially expressed genes as described for . T0 = start of induction phase; T15 and T18 = grazed F. vesiculosus 15 and 18 days after start of induction phase, respectively.
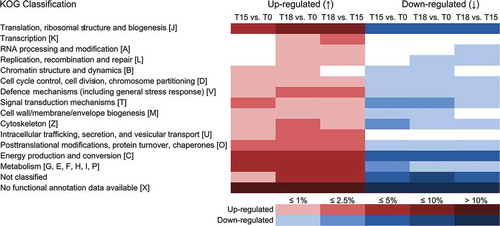
Table 2. Regulation of genes involved in defence mechanisms and stress response in Fucus vesiculosus after 15 and 18 days of grazing. Identification of regulated genes was based on microarray hybridizations and evaluated with a two-way ANOVA combining biological replicates. Genes were considered to be differentially expressed when P values were < 0.01 and calculated fold changes (FCs) were ≥ 1.5. Expression values of controls (i.e. control day 15 vs. day 0 and control day 18 vs. day 0) were subtracted from corresponding treatment values (i.e. treatment day 15 vs. day 0 and treatment day 18 vs. day 0) at each time point to obtain grazing-related changes in gene expression. Genes that were differentially expressed between days 15 and 18 are also shown (T18 vs. T15). T18 vs. T15 fold changes were calculated by dividing the values of T18 vs. T0 by the values of T15 vs. T0. T0 = start of induction phase; T15 and T18 = grazed F. vesiculosus 15 and 18 days after start of induction phase, respectively. Positive FCs indicate an increase in the expression level in previously grazed F. vesiculosus pieces relative to controls, while negative FCs indicate a decrease in the expression level.
Table 3. Regulation of genes involved in photosynthesis in Fucus vesiculosus after 15 and 18 days of isopod grazing. Identification of differentially expressed genes as well as calculation and interpretation of fold changes (FCs) as described for . T0 = start of induction phase; T15 and T18 = grazed F. vesiculosus 15 and 18 days after start of induction phase, respectively.
Table 4. List of 15 Fucus vesiculosus genes that showed strong up-regulation 15 and/or 18 days after onset of grazing. Identification of differentially expressed genes as well as calculation and interpretation of fold changes (FCs) as described for . T0 = start of induction phase; T15 and T18 = grazed F. vesiculosus 15 and 18 days after start of induction phase, respectively. Genes with strong responses 18 days, but not 15 days, after onset of grazing printed in bold.
Fig. 7. Model showing grazing-induced changes in photosynthesis, carbohydrate and lipid metabolism, and defences in Fucus vesiculosus. Grazing by Idotea baltica results in down-regulation of photosynthesis that would lead to a reduced availability of energy, reducing power and precursors (dashed arrows). At the same time, grazing results in the activation of glycolysis, pentose phosphate pathway (PPP) and β-oxidation, leading to the accumulation of energy, reducing equivalents and precursors that may then be used to induce defence mechanisms, such as reactive oxygen species (ROS), secondary metabolites and cysteine proteases (solid arrows).