Figures & data
Fig. 1. Sampling sites of P. antarctica (white dots) and current systems in the Southern Ocean (redrawn from Rintoul et al., Citation2001). White arrows indicate the Antarctic Coastal Current (ACoC), acting as counter-current of the ACC.
Table 1. Number of alleles (Na) and effective number of alleles (EffNa), observed heterozygosity (Ho), expected heterozygosity (He, genetic diversity), inbreeding coefficient (Gis) and percentage of missing data per locus.
Fig. 2. Number of unique genotypes when considering from one and up to seven microsatellites of the data set. Whereas all isolates shared genotypes for at least two loci, no isolate shared more than five of the analysed seven microsatellites indicating the great variation even within isolates from a single bucket of seawater.
Table 2. Results of partial Mantel tests.
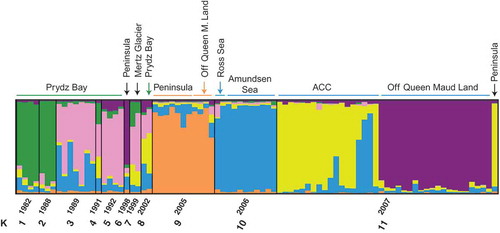
Fig. 3. Assignment of individuals (coloured bars) to populations using full data set excluding two for which no sampling time information was available (86 isolates, see Supplementary Table 1) and the program STRUCTURE with population ‘time’ prior (npops = 11). Run parameters: 10 independent runs, burn-in 50 000 generations, MCMC 100 000 generations. In the diagrams below, the likelihood of the dataset for a given K (right) and Delta K, with the most likely number of K for the data set following Evanno et al. (Citation2005) is shown. Both Delta K and the average likelihood for a given K were highest for K = 6 from the 10 independent runs.
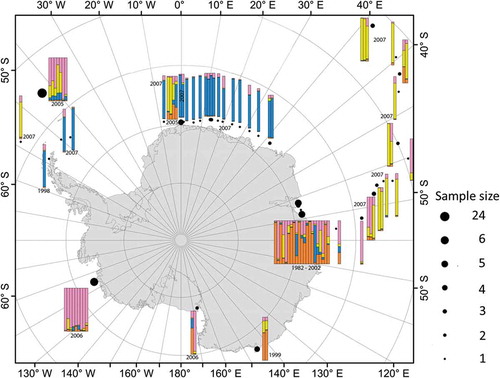
Fig. 4. Assignment of individuals (coloured bars) to populations using full data set (with the exception of those where no sampling date was given, i.e. 85 isolates) and the program STRUCTURE without prior on population origin/time. Run parameters: 10 independent runs, burn-in 50 000 generations, MCMC 100 000 generations. Following the correction method of Evanno et al. (Citation2005), the highest likelihood for a given K was for K = 4. Colours refer to the proportions of cluster for each genotype found.