Figures & data
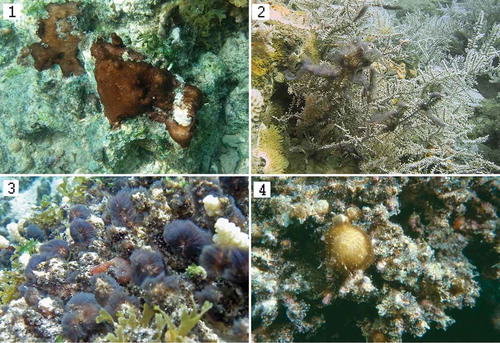
Figs 1–4. Field populations of: Fig. 1. Hydrocoleum coccineum Mayotte-4, reef Cou 4-2, 2 m depth; Fig. 2. Field population of H. glutinosum Mayotte-2, attached to Acropora (reef CB2), depth 7 m; Fig. 3. H. majus Mayotte-5; reef Cou 4-2, 2 m depth; Fig. 4. H. glutinosum PP1. Noumea lagoon, New Caledonia.
Figs 5–15. Photomicrographs of: Figs 5–14: Hydrocoleum populations representing six morphospecies (note distinctions in size, trichome morphology and pigmentation) and Fig. 15. Blennothrix ganeshii Mex3. Fig. 5. H. coccineum TK21; Fig. 6. H. lyngbyaceum T3; Fig. 7. H. coccineum M4; Fig. 8. H. glutinosum M21; Fig. 9. H. glutinosum M34; Fig. 10. H. cantharidosmum GC; Fig. 11. H. majus RU2007; Fig. 12. H. majus M5; Fig. 13. Exsiccate specimens from the NHN: H. lyngbyaceum (L0055299); Fig. 14. Exsiccate specimens from the Herbarium NHN: H. brebissonii (L0571047); Fig. 15. Filaments of Blennothrix ganeshii Mex3. Scale bar for Figs 5–12 is in Fig. 5.
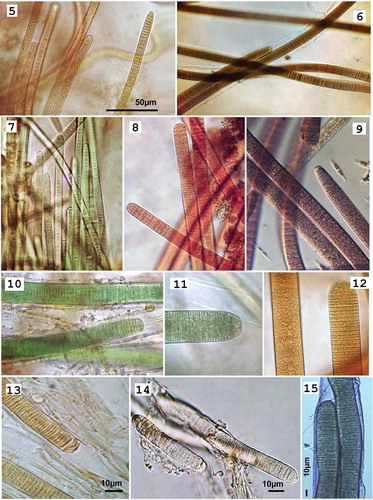
Table 1. Morphotypic properties of studied Hydrocoleum populations.
Fig. 16. Cell dimensions: cell width (CW) vs. cell length (CL) plotted as ‘cross diagrams’ of means ± standard deviation for Hydrocoleum populations from three different geographic locations: Mayotte, Tulear and Noumea presented as cross diagrams of cell width vs cell length for each population. Cell dimensions are measured as means ± standard deviation. The area covered by the crosses in each diagram, with arms extending one standard deviation on each side of the mean, include about 63% of the sample (about 95% of the cells measured scatter over the field outlined by two standard deviation distance from the mean value). The areas marked by crosses include about 63% of the sample. The lowest diagram shows the size ranges of different Hydrocoleum species as described by Gomont (Citation1892).
Figs 17–20. Transmission electron microscopy of: Figs 17–18. Blennothrix ganeshii Mex3; Figs 19–20. Cultured strain Hydrocoleum cantharidosmum GC (C, D). Differences in cell division pattern are visible.
Fig. 21. 16S rRNA gene-based phylogenetic reconstruction based on ML methods, showing the affiliation of Hydrocoleum populations obtained from Mayotte, Tulear, Iz, Gran Canaria and two herbarium specimens together with Blennothrix ganeshii populations and previously published sequences. Accession numbers are indicated in parentheses. The scale bar shows 10% sequence divergence. Sequences obtained in this study are marked in bold. Short sequences are marked with ’*’.
Fig. 22. Phylogenetic tree of nifH gene based on ML methods from four selected populations from the present study of Hydrocoleum: H. lyngbyaceum IZ, H. lyngbyaceum (NHN), Hydrocoleum majus RU2007 and Hydrocoleum brebissonii (NHN) together with three other nifH sequences from Hydrocoleum populations from New Caledonia (Abed et al., Citation2006) and Blennothrix ganeshii population from Mexico. The scale bar shows 10% sequence divergence. Sequences obtained in this study are marked in bold.