Figures & data
Table 1. Subareas and associated number of sampling stations for the Brittany maerl beds.
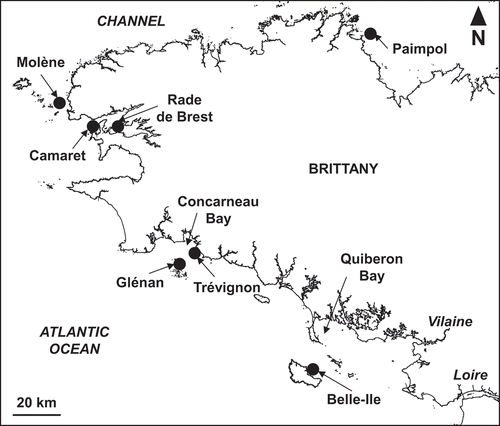
Fig. 1. Location of the seven Brittany maerl beds studied by IFREMER (Paimpol, Molène, Glénan, Trévignon and Belle-Ile) and IUEM (Rade de Brest and Camaret).
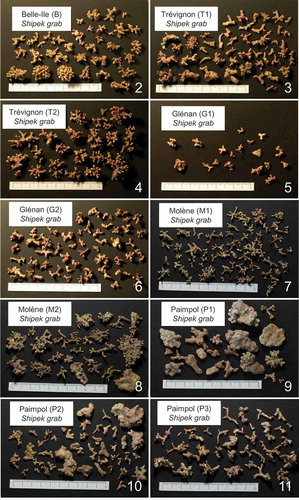
Figs 2–11. Examples of thallus morphology found within the subareas of the maerl beds of Belle-Ile (B), Trévignon (T1 and T2), Glénan (G1 and G2), Molène (M1 and M2) and Paimpol (P1, P2 and P3).
Figs 12–13. Examples of thallus morphology found within the Smith-McIntyre grab samples collected within the maerl beds of Rade de Brest (subarea R15, Fig. 12) and Camaret (subarea C2, Fig. 13).
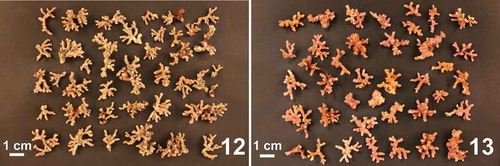
Table 2. Morpho-sedimentary and hydrodynamic characteristics of the maerl beds of the Brittany coast.
Table 3. Physico-chemical properties of the water column generated near the bottom by three-dimensional numerical models for the maerl beds of the Brittany coast.
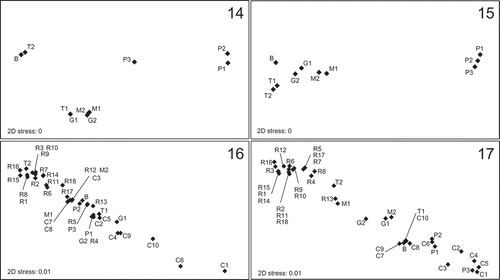
Figs 14–17. Non-metric multidimensional scaling (NMDS) ordinations of the subareas of the Brittany maerl beds (Belle-Ile (B), Trévignon (T1–T2), Glénan (G1–G2), Camaret (C1–C10), Rade de Brest (R1–R18), Molène (M1–M2) and Paimpol (P1–P3)). NMDS ordinations are based on the percentage cover of maerl thalli (Fig. 14) and the associated best subset of explanatory environmental variables (annual means of salinity, nitrate concentration and current velocity, Fig. 15), and on the proportion of living thalli (Fig. 16) and the associated best subset of explanatory environmental variables (depth and mud content, Fig. 17).
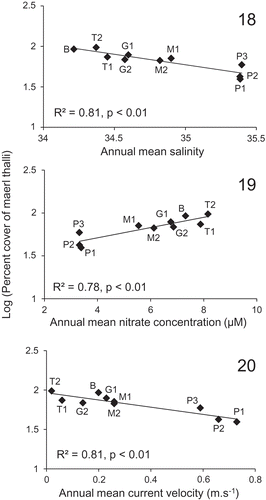
Figs 18–20. Significant linear relationships (P < 0.01) between the percentage cover of maerl thalli observed in the subareas of the Brittany maerl beds (Belle-Ile (B), Trévignon (T1–T2), Glénan (G1–G2), Molène (M1–M2) and Paimpol (P1–P3)) and environmental variables (annual means of salinity, nitrate concentration and current velocity).
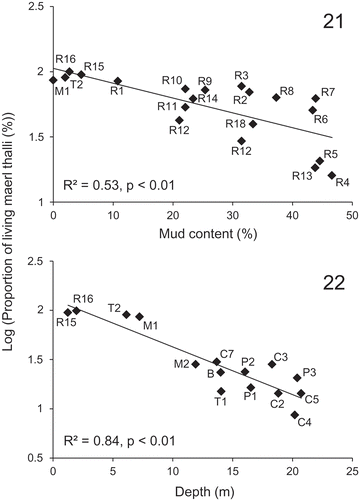
Figs 21–22. Significant linear relationships (P < 0.01) between the proportions of living thalli observed in the subareas of the Brittany maerl beds (Belle-Ile (B), Trévignon (T1–T2), Camaret (C1–C10), Rade de Brest (R1–R18), Molène (M1–M2) and Paimpol (P1–P3)) and environmental variables (depth and mud content). The relationship with mud content was established for subareas < 10 m deep (Fig. 21), while the relationship with depth was established for subareas with < 10% mud (Fig. 22).