Figures & data
Fig. 1. Photograph of Kainga Reef from the cliff, facing southwest. Black bar, 2 m; red dots, mid pools; blue dots, edge pools.
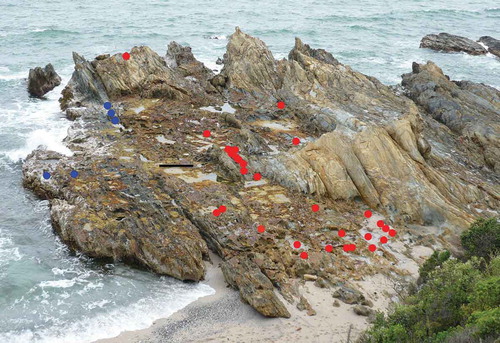
Fig. 2. A diagrammatic explanation of how growth in vesicle number (Rv) was measured in situ in mature fronds of Hormosira. Letters to the left name the vesicles, lower case for Time 1, upper case for Time 2. What was the third vesicle at Time 1 was designated the scale vesicle and its diameter assumed to be unchanged by Time 2 (see text). The formulae for determining the proportional size of the two apical vesicles relative to the appropriate mature vesicles are shown to the right. The equation expresses the calculated final (at Time 2) number of vesicles apical to the original third vesicle minus the same at Time 1, divided by the time interval in days.
Fig. 3. Mean densities of recruits and deaths during the four seasons from 1 March 2002 to 28 February 2012 in 29 mid pools on Kainga Reef with a total area of 3.46 m2. Mean recruitment over 10 years was 27.5 germlings m−2 year−1. Different letters indicate significant difference (P < 0.05, Tukey HTD test and P = 0.0018, Kruskal–Wallis). Bars, standard error.
Fig. 4. The density of individuals of Hormosira in 29 mid pools on Kainga Reef (total number of plants in the monitored areas divided by the total monitored area of 3.46 m2) on 1 March each year. Error bars would be inappropriate because pools had different areas.
Table 1. A comparison of the growth of Hormosira expressed linearly or as natural logarithms (exponential growth) correlated with time.
Fig. 5. The number of vesicles and lengths of non-fertile, fertile female and fertile male germlings (total of 78 plants) sampled in September 2008. The age of the plants shown was calculated from the vesicle number of each, assuming it took 5–8 months to reach 3 vesicles, and using the mean relative growth rate in vesicle number of 0.00886 vesicles day-1 observed in situ.
Fig. 6. The area covered by each of five plants of Hormosira in five different mid pools on Kainga Reef (each with different symbol) during 6 years from the start of 2002.
Fig. 7. The mean growth rates of single apices of fronds over 3 years in pools on Kainga Reef. Mid, pools >6 m from edge of the reef (mean n (fronds) = 30); edge, pools <3 m from edge (mean n (fronds) = 17). Bars, standard error. Overall mean for mid pools was 6.59 and edge pools 7.81 vesicles year-1.
Fig. 8. The growth rate of fronds of Hormosira in pools at various heights on the Kainga Reef in late summer 2009. Mid, pools >6 m from edge of the reef; edge, pools <3 m from edge. The difference between the mid and edge pools between 1.1 and 1.4 m LAT (n = 6 and 11 respectively) was significant at P = 0.0105, Mann–Whitney.
Fig. 9. The lifespan from first observation, in 2-month intervals, of plants of Hormosira in 29 mid pools on Kainga Reef monitored from 2002 to 2011. The last column represents the number of originally observed plants that were still present in March 2013.
Fig. 10. Per cent survivorship of Hormosira, in 29 mid pools on Kainga Reef, in 10 annual cohorts plus those present previously (n shown above), each being the number at the beginning of March that had arisen during the previous 12 months.
Table 2. Numbers of plants of Hormosira which died in clusters with a known or unknown cause each calendar year (number of pools in brackets). Eleven of the 29 mid pools studied were vulnerable to sand incursion.
Fig. 11. Fluorescence of Hormosira vesicles after exposure in evaporating seawater and either gradual return to normal seawater or being held for 2 or 5 days in hypersalinity. Between 124 and 142 psu 5-day exposure was significantly more stressful than 0- and 2-day pooled (P = 0.05, Mann–Whitney).
Figs 12–17. Browning of Hormosira. Fig. 12. A shallow pool in January showing browning of the upper sides of vesicles after exposure to air (blue arrows). Fig. 13. Partially brown vesicles (blue arrow) in February. Fig. 14. Complete recovery 45 days later. Fig. 15. Pool with a deeper central basin (water depths in blue) in March after partially drying out. Fig. 16. Browning of plant, seen healthy 26 days previously, after removal of a decomposing Phyllospora comosa frond from the pool in December. Fig. 17. Regrowth 8 months later.
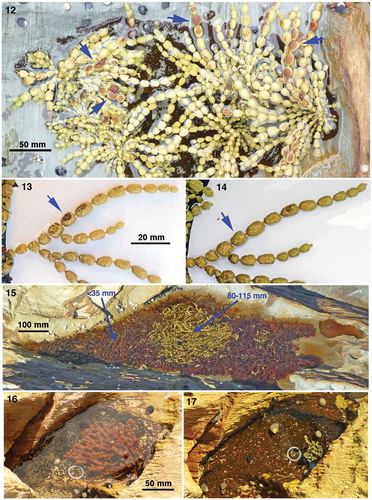
Table 3. The assessed state of Hormosira, in pools where it was present (out of 29 monitored), after a series of sunny days in near midsummer, when the pools were isolated at mid-day.
Fig. 18. The means during the seasonal quarters of daylength, 10-year mean of the sea surface temperature (SST) off Batemans Bay, ~20 km north of Kainga Reef (Manly Hydraulics Laboratory) and the mean maximum temperature of the mid pools; bars, standard error.