
Figures & data
Figs 1–6. LM images of field collected Didymosphenia hullii. , , : Cells attached to their stalks illustrate cell division. Scale bars = 20 μm (, , ); 10 μm (); 50 μm (); 40 μm ().
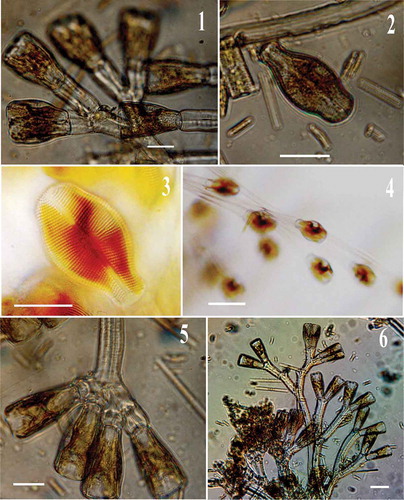
Figs 7–15. LM images of Didymosphenia hullii cells in valve view showing size variation. : LM image of D. hullii cell in girdle view. Scale bars = 10 μm.
Figs 17–25. LM images of Didymosphenia geminata cells in valve view showing size variation. : Courtesy of S. Spaulding, –: Courtesy of D. Metzeltin. Reprinted from Metzeltin & Lange-Bertalot (Citation2014, Iconographia Diatomologica 25) with the permission of Koeltz Scientific Books. : D. hullii cell in valve view. Scale bars = 10 μm.
Figs 26–28. SEM images of single valves of Didymosphenia hullii retrieved after PCR reactions. : The valve is fractured but still identifiable. : High magnification image of a cell with two stigmata. Scale bars = 20 μm (, ); 5 μm ().
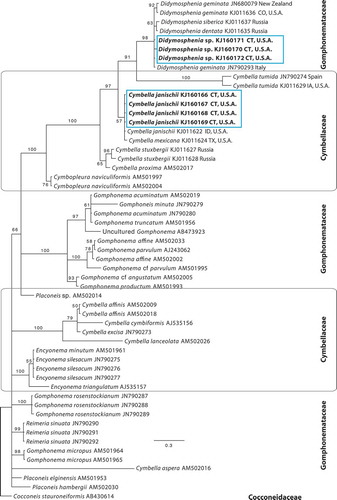
Fig. 29. Bayesian phylogenetic tree based the V4 region of the 18S rDNA of selected published sequences of Cymbellales, plus newly obtained sequences from three isolated single cells of Didymosphenia sp. and four sequences of Cymbella janischii (GenBank accession numbers are included in the taxon labels). The current taxonomic families are indicated. Bayesian posterior probabilities (BPP × 100) values indicate node support. Scale bar = expected number of substitutions/site.
Figs 30–38. SEM images of Didymosphenia hullii on stalks from the West Branch of the Farmington River showing bifurcated stalks with cells attached. Scale bars = 20 µm (, , ); 50 µm (, , ); 40 µm (); 5 µm (); 200 µm ().
Figs 39–44. SEM images of Didymosphenia hullii. : Internal view of the valve displaying three stigmata. : View of apical pore field, footpole. , : Central valve view with striae, and 1 and 4 stigmata, respectively. : Internal view of central valve showing two stigmata and uniseriate striae. : External views of frustule girdle and valve morphology. Scale bars = 20 μm (); 5 μm (, ); 10 μm (, ); 30 μm ().
Table 1. Comparison of traits of selected Didymosphenia taxa and their localities. Morphology of areolae determined using images and descriptions in Metzeltin & Lange-Bertalot (Citation1995, Citation2014) and Mrozińska et al. (Citation2006).