Figures & data
Table 1. Strains and conditions at source.
Fig. 1. Molecular phylogenetic analysis of TvB and SH strains based on the ITS1-5.8S-ITS2 region. The evolutionary history was inferred by using the Maximum Likelihood method based on the Tamura–Nei model (Tamura & Nei, Citation1993). The tree with the highest log likelihood (−4510.7914) is shown. A discrete Gamma distribution was used to model evolutionary rate differences among sites (five categories (+G, parameter = 0.3717)). The rate variation model allowed for some sites to be evolutionarily invariable ([+I], 45.6994% sites). The analysis involved 50 nucleotide sequences. There were a total of 574 positions in the final dataset. The tree was rooted using Parachlorella sequences as outgroup. A. = Actinastrum; Chl. = Chlorella; M. = Micractinium; P. = Parachlorella. ![]()
![Fig. 1. Molecular phylogenetic analysis of TvB and SH strains based on the ITS1-5.8S-ITS2 region. The evolutionary history was inferred by using the Maximum Likelihood method based on the Tamura–Nei model (Tamura & Nei, Citation1993). The tree with the highest log likelihood (−4510.7914) is shown. A discrete Gamma distribution was used to model evolutionary rate differences among sites (five categories (+G, parameter = 0.3717)). The rate variation model allowed for some sites to be evolutionarily invariable ([+I], 45.6994% sites). The analysis involved 50 nucleotide sequences. There were a total of 574 positions in the final dataset. The tree was rooted using Parachlorella sequences as outgroup. A. = Actinastrum; Chl. = Chlorella; M. = Micractinium; P. = Parachlorella. Display full size Species added in this study.](/cms/asset/52811959-f8a7-47ae-8b84-edf8aaa0ec1a/tejp_a_1193772_f0001_b.gif)
Fig. 2. Molecular phylogenetic analysis of TvB and SH strains based on rbcL sequences. The evolutionary history was inferred by using the Maximum Likelihood method based on the Tamura 3-parameter model (Tamura, Citation1992). The tree with the highest log likelihood (−2246.5096) is shown. A discrete Gamma distribution was used to model evolutionary rate differences among sites (5 categories (+G, parameter = 0.2753)). The analysis involved 29 nucleotide sequences. There were a total of 493 positions in the final dataset. The tree was rooted using Parachlorella sequences as outgroup. A. = Actinastrum; Chl. = Chlorella; M. = Micractinium; P. = Parachlorella. ![]()
Table 2. Growth rates of TvB at the logarithmic growth phase under various combinations of temperatures and salinities.
Table 3. Growth rates of SH at the logarithmic growth phase under various combinations of temperatures and salinities.
Table 4. Initial and maximal ACD at 45ºC in the two strains (Dt0 and Dmax respectively), the volumetric ratio (Vmax/Vt0) and the days needed to achieve Vmax. The statistical bounds represent one standard error.
Fig. 3. Growth of (a) TvB and (b) SH at different temperatures and salinities, as measured by OD. Data points represent mean values of triplicates.
Fig. 4. Logarithmic representation of growth parameters in (a) TvB and (b) SH strains at 45ºC in maintenance salinities: 75% SW for TvB and 50% SW for SH. Data points represent mean values of triplicates.
Fig. 5. Changes in ACD in the (a) TvB and (b) SH strains, exposed to OT of 35ºC and SOT of 45ºC at maintenance salinities: 75% SW for TvB and 50% SW for SH. Bars represent standard error.
Fig. 6. Time-course (days 0–13) of ACD distribution in TvB and SH cultures, grown at (a) 35ºC and (b) 45ºC, at 75% SW for TvB and at 50% SW for SH. White bars, 0.7–4 µm range; dotted bars, 4–8 µm range; black bars, > 8 µm range. Sample sizes range between 136–731.
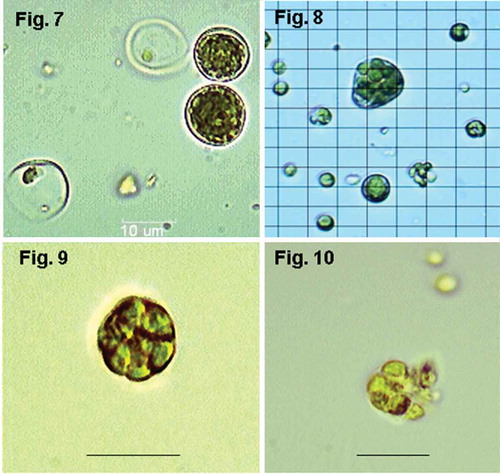
Figs 7–10. Alternative forms of cells and cell division at 45ºC. Fig. 7. SH, d 5 (salinity 50% SW): spore-bearing cells with homogeneously distributed autospores and empty sporangia with some remaining spores still inside; Fig. 8. TvB, d 15 (salinity 75% SW): giant irregular sporangium with secondary small sporangia inside (so-called ‘palmelloid bodies’); Fig. 9. TvB, d 6: sporangium with ‘palmelloid bodies’; Fig. 10. TvB, d 6: sporangium with ‘palmelloid bodies’ releasing autospores. Magnification ×1000, scale bars and grid = 10 μm.