Figures & data
Table 1. Specimens of D. cyanoloma used for the network analysis, with indication of haplotype number (h), habitat, locality with coordinates, year of sampling, and accession number per phylogenetic marker.
Table 2. Primer sequences for the mitochondrial markers nad6–nad11 and atp9–orf11.
Fig. 1. Phylogenetic tree obtained by ML-inference of a dataset containing six genes (partial LSU rDNA, rbcL, psbA, cox1, cox3 and nad1). Numbers at the nodes indicate posterior probabilities followed by ML-bootstrap values.
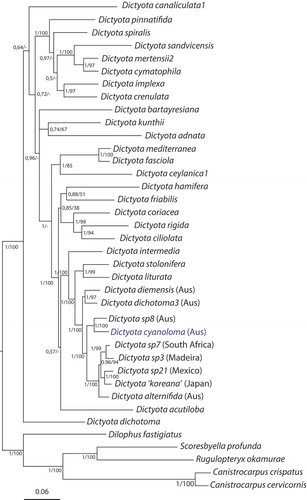
Fig. 2. Distribution map of a global Dictyota data set (green) highlighting the occurrences of D. cyanoloma (red) and D. sp8 (yellow).
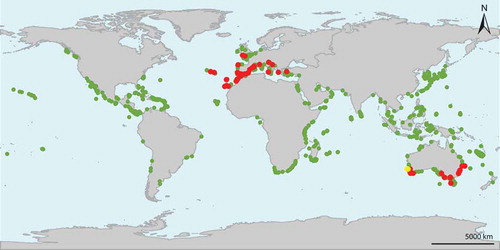
Fig. 3. The sample locations (dots) within the native range (A) and the region of introduction (B) are reported. The reported isotherms on both maps are the annual mean maximum and minimum sea surface temperatures bordering the distribution range of Dictyota cyanoloma within the native region (full lines) contrasted with the annual mean maximum and minimum sea surface temperatures bordering the distribution within the introduced range (dashed lines). A distinction is made between samples from this study (red), earlier published records (green), photographic evidence (blue) and herbarium samples (yellow).
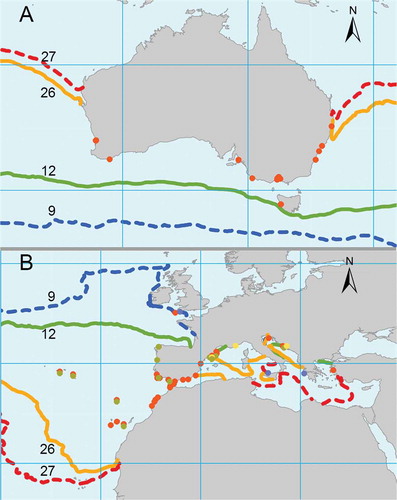
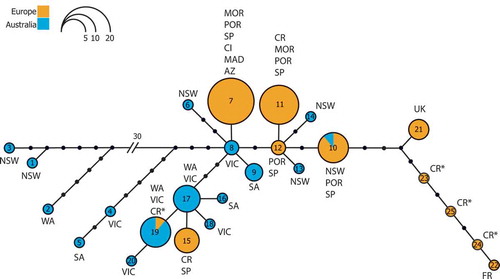
Fig. 4. Haplotype network based on a ML phylogeny indicating Australian (blue), European (orange) and sequenced Split herbarium samples (asterisks). The size of the circles is proportional to the amount of individuals of that haplotype. The number specifies the haplotype. (WA: West Australia, NSW: New South Wales, VIC: Victoria, SA: South Australia, MOR: Morocco, POR: Portugal, AZ: Azores, MAD: Madeira, SP: Spain, CI: Canary Islands, CR: Croatia, UK: United Kingdom, FR: France.)
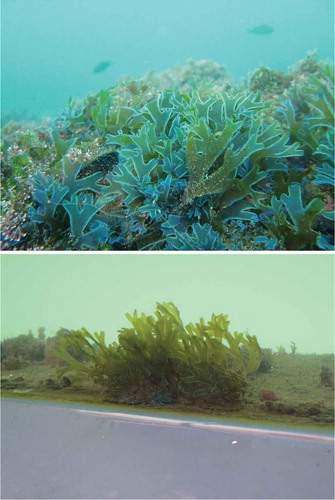
Figs 5 and 6. Dictyota cyanoloma. Fig. 5. Dictyota cyanoloma clearly showing its characteristic blue iridescent margin, photograph taken by Joana Aragay, port of Almeria, 2013. Fig. 6. Boat hull fouled by Dictyota cyanoloma, photograph taken by Olivier De Clerck at Garachico Bay, Tenerife, 2014.