
Figures & data
Figure 1. Consensus tree from the last 100 trees of the BI analysis of the diatoms from datasets 11 (A) and 25 (B) showing the outgroups used in each analysis and the monophyletic classes collapsed into triangles. Triangle 1 = Class Coscinodiscophyceae, Triangle 2 = Class Mediophyceae, Triangle 3 = Class Bacillariophyceae, Triangle 4 = Class Bolidophyceae/phyta. Posterior probabilities expressed as whole numbers from the BI analysis are shown on the relevant branch nodes. Scale bar in B represents 0.3 substitutions/site.
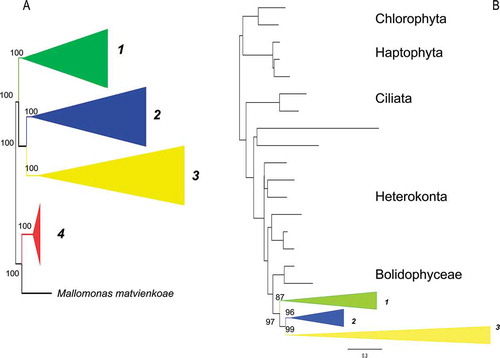
Figure 2. Consensus BI tree from the last 100 trees of the analysis of the Class Coscinodiscophyceae from datasets 11 (A) and 25 (B). Thickest lines in A represent 100% PP support for that clade, next thickest line represents >50 % support. Clades are numbered and lettered going from left to right in the tree as discussed in the text, e.g. 1, a. Scale bar in B represents 0.3 substitutions/site.
Figure 3. Consensus tree from the last 100 trees of the BI analysis of the Class Mediophyceae from datasets 11 (A) and 25 (B). Thickest lines in A represent 100% PP support for that clade, next thickest line represents >50 % support. Clades are numbered and lettered going from left to right in the tree as discussed in the text, e.g. 1> a> i. Scale bar in B represents 0.3 substitutions/site. Arrows mark two invasions of fresh waters.
Figure 4. Consensus tree from the last 100 trees of the BI analysis of the araphid diatoms from the Class Bacillariophyceae from datasets 11 (A) and 25 (B). Thickest lines in A represent 100% PP support for that clade, next thickest line represents >50 % support. Clades are numbered and lettered going from left to right in the tree as discussed in the text, e.g. 1> a> i. Scale bar in B represents 0.3 substitutions/site.
Figure 5. Consensus tree from the last 100 trees of the BI analysis of the raphid diatoms from the Class Bacillariophyceae from dataset 11 (A) and dataset 25 (B). All other centric clades removed from the tree. Every other clade is shaded in A and each clade is shown in detail in Supplementary . Thickest lines represent 100% PP support for that clade, next thickest line represents >50 % support. Clades are numbered and lettered going from left to right in the tree as discussed in the text, e.g. 1> a> i. Scale bar in B represents 0.3 substitutions/site.