
Figures & data
Fig. 1. Schematic representation of the sampling location.
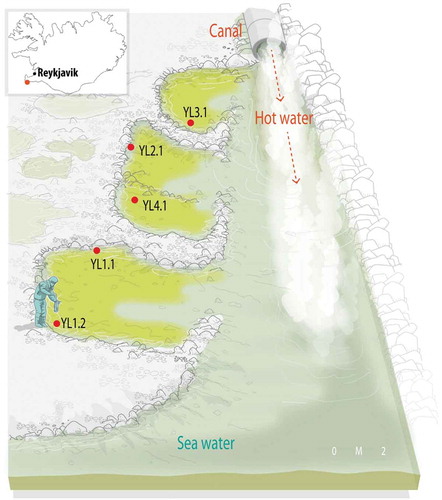
Fig. 2. Percentages of cyanobacterial communities in the different microbial mats.
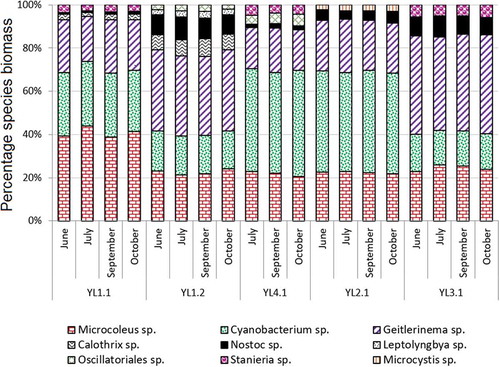
Fig. 3. Changes in relative maximum electron transport rate (rETRmax) and optimal quantum yield (Fv/Fm) for microbial mats under variable water temperature (Mat YL1.1: a, c, f, i; Mat YL1.2: b, d, g, j; Mat YL4.1: e, h, k) throughout the day from June to October. Data are expressed as means ± SD (n = 5).
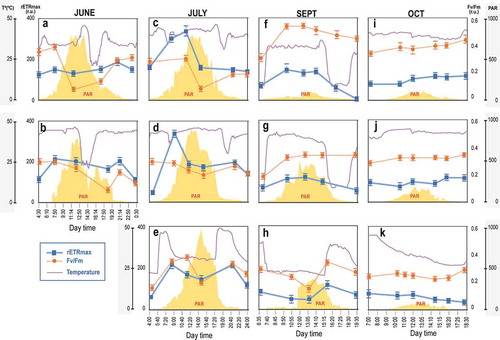
Fig. 4. Changes in relative maximum electron transport rate (rETRmax) and optimal quantum yield (Fv/Fm) for microbial mats under constant water temperature (Mat YL2.1: a, c, f, i; Mat YL3.1: b, d, g, j) throughout the day from June to October. Data are expressed as means ± SD (n = 5).
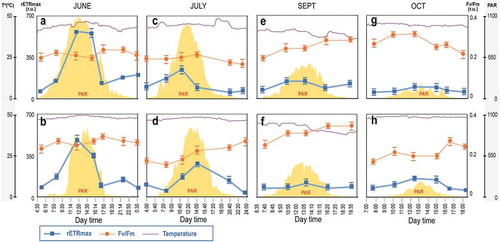
Fig. 5. Monthly variation of pigment content: Chlorophyll a-b (top), Phycobiliproteins (centre), Total carotenoids (bottom). Data are expressed as averaged daily pigment content ± SD (n = 5).
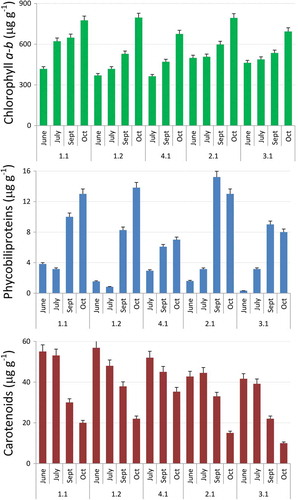
Table 1. Relative maximum electron transport rate (rETRmax) of five different microbial mats at different temperatures (20, 30, 40, 50 and 60ºC) and salinities (5, 20, 30‰) under controlled laboratory conditions.