Figures & data
Table 1. Environmental conditions of surface water temperature, solar radiation and UV-index during the course of experimentation in 2014.
Table 2. Variance components (%) due to the random effects of genetic individual and experimental line with their statistical significance in physiological responses (ETRmax, Ek and αETR) of Fucus vesiculosus at the end of the floating period.
Fig. 1. Floating time (days) of different genetic individuals of Fucus vesiculosus (n = 14) tethered in their native habitat. Data show genetic individual estimates (mean ± SE, based on n = 3 thalli). Due to the loss of four thalli, the mean of the genetic individuals 1, 7, 8 and 10 are based on n = 2 thalli.
Fig. 2. Scatter plots showing the relationship between floating time and final ETRmax (a) as well as floating time and final Ek (b) of all tethered thalli recovered at the end of experimentation (n = 38, four were lost). Different symbols show the n = 38 thalli with different morphologies. Dots = receptacle and vesicle carriers; triangles = only vesicle carriers; and squares = only receptacle carriers. R2 values for the fit of the polynomial regressions are displayed. Bar plot (c) shows the genetic individual estimates (mean of the n = 3 thalli ± SE, n = 14) for the final αETR.
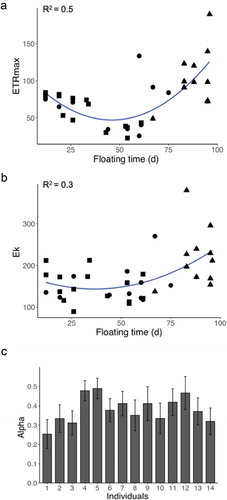
Table 3. Results from the structural equation models.
Fig. 3. Path model III (see ) showing the best fit. (a) Standardized path coefficients are provided for each one-headed arrow, and correlation coefficient for the two-headed one. The asterisk indicates significant regression weights. The curved arrow indicates significant correlation among the observed variables. (b) Multiple regression scatter plot, where the floating time is plotted against the predicted values. The latter ones are generated by a multiple regression model including the three independent variables: # of receptacles (β ± SE: –0.26 ± 0.8, p < 0.01), # of vesicles (1.21 ± 0.32, p < 0.001), and growth rate (−1.74 ± 0.84, p < 0.05), with an R2 of 0.53. The grey area surrounding the regression line represents the confidence interval.
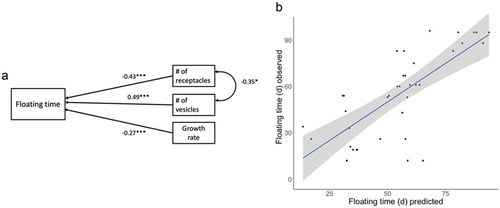
Fig. 4. Colonization of invertebrates with floating time (days). Results are from n = 24 Fucus vesiculosus thalli.