Figures & data
Fig. 1. Phylogenetic tree from Bayesian inference (BI) based on concatenated conservative and V4 regions of 18S rRNA gene, and a partial rbcL gene sequence. Support values at nodes from left to right are posterior probabilities (BI) and bootstrap percentages (ML). Scale bar indicates substitutions per site.
Figs 2–5. Morphology of representative vegetative frustules and valves, scanning electron microscopy (SEM). Fig. 2. Clone PLB-B3; shows six frustules in a chain. Fig. 3. Clone PLB-B3; shows girdle view of valve, pseudocelli (arrows) and external tubes of the rimoportulae (arrowheads). Fig. 4. Clone Mex-A; shows external valve surface, valve outline, pseudocelli (arrows), spines scattered on valve face, hyaline area of the valve where the valve face is indented (arrowheads), and pores. Fig. 5. Clone PLB-B3; internal view of valve, openings of the rimoportulae (arrows) and a hyaline ring corresponding to a circular indentation present in small valves with nearly circular outline (arrowheads). Scale bars: Fig. 2, 100 µm; Figs 3–5, 10 µm.
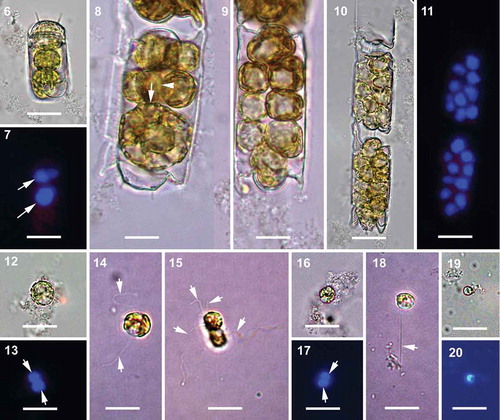
Figs 6–20. Spermatogenesis, brightfield and epifluorescence microscopy. All the cells with flagella are from live samples. Fig. 6. Initiation of depauperating mitoses within the spermatogonangium. Fig. 7. Corresponding epifluorescence image of Fig. 6, arrows indicating two DAPI stained diploid nuclei. Figs 8, 9. Intermediate stages further along in a series of depauperating mitoses within the spermatogonangium. In Fig. 8, arrow indicates the plane of first mitotic division (parallel to apical axis) and arrowhead indicates the subsequent second plane of mitotic division in a more advanced sibling cell (parallel to pervalvar axis). Fig. 10. Primary spermatocytes within the spermatogonangial frustule resulting from several rounds of depauperating mitoses. Fig. 11. Corresponding epifluorescence image of Fig. 10 showing strongly DAPI stained diploid nuclei. Fig. 12. Primary spermatocyte. Fig. 13. Corresponding epifluorescence image of Fig. 12. Arrows indicate the DAPI stained nuclei after meiosis I. Fig. 14. Primary spermatocyte with two flagella (arrows). Fig. 15. Quadriflagellated primary spermatocyte during cytokinesis following meiosis I. Arrows indicate the flagella. Fig. 16. Secondary spermatocytes with flagella lost due to fixation. Fig. 17. Corresponding epifluorescence image of Fig. 16. Arrows indicate the DAPI stained nuclei following meiosis II. Fig. 18. A uniflagellated (arrow) secondary spermatocyte, another flagellum might have been lost. Fig. 19. Male gamete; flagellum lost during sample preparation. Fig. 20. Corresponding epifluorescence image of Fig. 19. Scale bars: 20 µm.
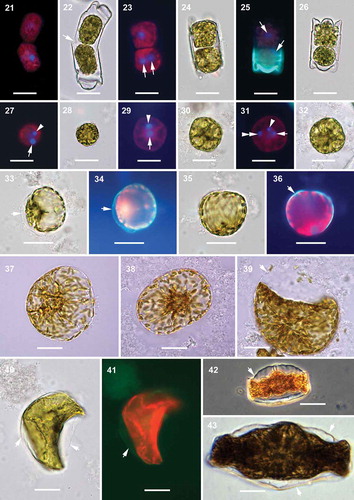
Figs 21–43. Oogenesis and auxospore development, epifluorescence and brightfield microscopy. Fig. 21. Two secondary oocytes produced by oogonium. Fig. 22. Corresponding brightfield image of Fig. 21. Arrow indicates the opening of the oogonial theca to release the secondary oocytes, or possibly allow sperm penetration. Fig. 23. Two secondary oocytes produced by the oogonium, one of them with two DAPI stained nuclei of equal size (arrows) after meiosis II. Fig. 24. Corresponding brightfield image of Fig. 23. Fig. 25. Two secondary oocytes with DAPI stained nuclei (arrows) after meiosis I. Green fluorescence represents PDMPO incorporation into the new hypovalve of the oogonial frustule. Fig. 26. Corresponding brightfield image of Fig. 25. Fig. 27. Free egg cell with one functional (arrow) and one pyknotic (arrowhead) DAPI stained nucleus. Fig. 28. Corresponding brightfield image of Fig. 27. Fig. 29. Another free egg cell with one functional (arrow) and one pyknotic (arrowhead) DAPI stained nucleus. Fig. 30. Corresponding brightfield image of Fig. 29. Fig. 31. Tri-nucleated egg cell; with one functional (arrow) and one pyknotic (arrowhead) nuclei of the egg and another functional nucleus (double arrowhead) possibly from a sperm cell. Fig. 32. Corresponding brightfield image of Fig. 31. Fig. 33. Initiation of plasmolysis of the protoplast in the young sub-globular auxospore. Arrow indicates auxospore envelope. Fig. 34. Corresponding epifluorescence image of Fig. 33. Arrow indicates PDMPO stained young auxospore envelope (green). Fig. 35. Sub-globular auxospore. Fig. 36. Corresponding epifluorescence image of Fig. 35. Arrow indicates PDMPO stained young auxospore envelope (green). Figs 37, 38. Further anisodiametric expansion of the globular auxospore. Fig. 39. Constriction of the protoplast and separation of plasma membrane from the auxospore envelope. Arrow indicates eroding auxospore wall. Fig. 40. Initiation of initial cell formation within the auxospore envelope. Arrows indicate the auxospore envelope. Fig. 41. Corresponding epifluorescence image of Fig. 40. Arrow indicates PDMPO incorporation in auxospore envelope (green). Chloroplast auto-fluorescence appears in red. Fig. 42. Phase contrast image of the initial cell within the auxospore envelope (arrow). Fig. 43. The complete initial cell. Arrows indicate the auxospore envelope still attached. Scale bars: Figs 21–32, 20 µm; Figs 33–43, 25 µm.
Figs 44–48. Mitotically dividing cells, oocytes, eggs and spherical cells, scanning electron microscopy. Fig. 44. A fully extended frustule, possibly following mitosis, demonstrating the structure of cingula in a vegetative frustule. Fig. 45. An oogonial theca with a secondary oocyte (or an egg) showing copulae similar to those in a vegetative frustule (arrowheads). Fig. 46. A close-up of the distal part of the oogonial cingulum in Fig. 45 showing the structure of copulae (arrowheads) different from those located closer to the valvocopula indicated in Fig. 45. Fig. 47. A close up of specimen from Fig. 45 showing no incunabular scales. Fig. 48. A spherical cell, possibly a small egg, showing the very delicate cell membrane (preserved on smooth surface of the bottom part of the cell) with no siliceous structure in evidence. Scale bars: Fig. 44, 50 µm; Fig. 45, 25 µm; Fig. 46, 5 µm; Figs 47, 48, 10 µm.
Figs 49–51. Auxospore, scanning electron microscopy. Fig. 49. A slightly collapsed, subglobular auxospore showing siliceous components of the cell wall. Arrows indicate scales with a variety of shapes. This figure is a digitally constructed montage of four individual SEM images. Fig. 50. Various incunabular scales in the outermost layer of the auxospore wall. Arrow indicates scale with pattern mimicking the ornamentation pattern of vegetative valves in some thalassiosiroid diatom species. Fig. 51. Perizonial bands overlaid by a layer of incunabular scales. Scale bars: Fig. 49, 20 µm; Fig. 50, 3 µm; Fig. 51, 5 µm.
Figs 52–54. Auxospore cell wall, scanning electron microscopy. Fig. 52. A nearly mature, anisodiametric auxospore showing siliceous components of the cell wall. This figure is a digitally constructed montage of six individual SEM images. Fig. 53. Incunabular scales of various sizes, boundaries and patterning centres indicated with arrowheads. Fig. 54. Structure of three overlapping transverse perizonial bands (TPB1–3). Scale bars: Fig. 52, 25 µm; Fig. 53, 5 µm; Fig. 54, 10 µm.
Figs 55–58. Auxospore cell wall and initial cell, scanning electron microscopy. Fig. 55. The ends of the open transverse perizonial bands (arrows). Fig. 56. Segment of transverse perizonial band showing asymmetry across its width (arrows) relative to the loosely defined central rib (arrowheads). Fig. 57. Enlarged detail of initial valve in Fig. 58, showing its spines puncturing transverse perizonial bands (arrows). Fig. 58. An initial frustule shrouded in remnants of the dorsal part of the auxospore wall. Note transverse perizonial bands straddling the initial epivalve, low-topography valve face profile and imperfectly formed apical elevations. This figure is a digitally constructed montage of four individual SEM images. Scale bars: Fig. 55, 10 µm; Fig. 56, 1 µm; Fig. 57, 5 µm; Fig. 58, 20 µm.