Figures & data
Fig. 1–4 Uptake rates (µmol cm−2 h−1) for Heminura frondosa as a function of increasing NO3– concentration (µM) for algae acclimated to either (1) saturating irradiance (150 µmol photons m−2 s−1) and (2) limiting irradiance (30 µmol photons m−2 s−1) and NH4+ under (3) saturating irradiance (150 µmol photons m–2 s–1) and (4) limiting irradiance (30 µmol photons m−2 s−1). Solid lines indicate regression of best fit. Note that the y-axis range for graphs 1 and 2 are different to those of 3 and 4. Each symbol represents an individual macroalgal replicate (n = 5)
Fig. 5. Soluble tissue NO3− and NH4+ concentrations (µmol g WW−1) from Heminura frondosa individuals acclimated to saturating (150 µmol photons m−2 s−1) and limiting (30 µmol photons m−2 s−1) irradiance. Bars represent mean ± SE, n =10, * = p < 0.05 (Wilcoxon rank sum test)
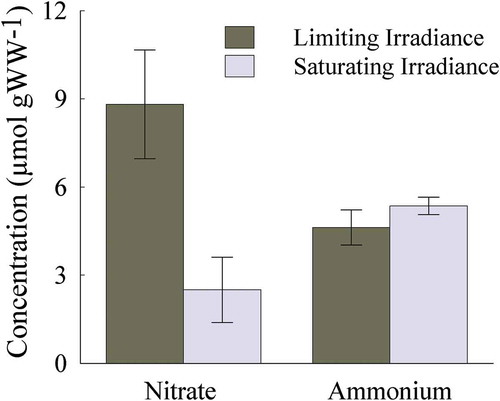
Fig. 6–7. Photosynthetic pigment content of Heminura frondosa (mg g WW−1) acclimated to saturating (150 µmol photons m−2 s−1) and limiting (30 µmol photons m−2 s−1) irradiance (6) PE and (7) Chl a. Bars represent mean ± SE, n =10, * = p < 0.05 (Wilcoxon rank sum test)
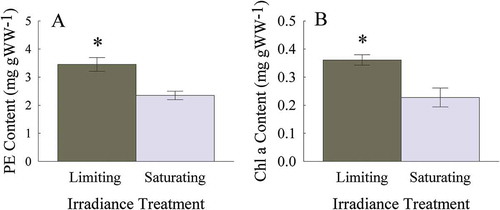
Fig. 8. NR activity (μmol NO3− reduced min–1 g WW–1) from Heminura frondosa acclimated under saturating (150 µmol photons m−2 s−1) and limiting (30 µmol photons m−2 s−1) irradiance. Bars represent mean ± SE, n = 10
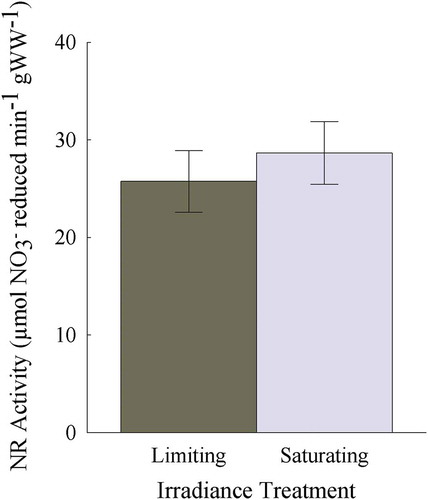
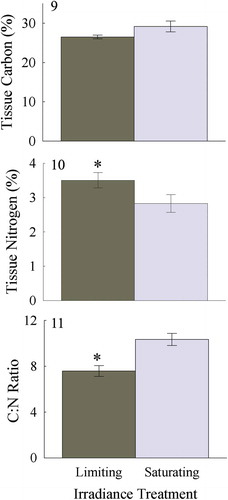
Fig. 9–11. Tissue carbon (9) and nitrogen content (10) expressed as %DW, and C:N ratio (11), for Heminura frondosa acclimated to saturating (150 µmol photons m−2 s−1) and limiting (30 µmol photons m−2 s−1) irradiance. Bars represent mean ± SE, n = 4, * = p < 0.05 (Wilcoxon rank sum test)