Figures & data
Fig. 1. Bayesian phylogenetic tree of the genera Crassiphycus, Hydropuntia and other closely related Gracilariaceae based on rbcL DNA sequences. Numbers above branches correspond to posterior probabilities and maximum likelihood bootstrap probabilities based on 1000 replications, respectively (PP/BP). Branches marked with a star have full phylogenetic support: PP = 1.0 and BP = 100%. Recognized phylogeographic groups: Indo-Malay Phylogroup (Gulf of Thailand Sea and Mallaca Strait), South China Sea Phylogroup (South China Sea and the Philippines), North-eastern (NE) Brazil Phylogroup, South-eastern (SE) Brazil Phylogroup, and the North-western (NW) Phylogroup. * = actual branch length is 50% reduced for aesthetical purposes. Scale bar = substitutions per site
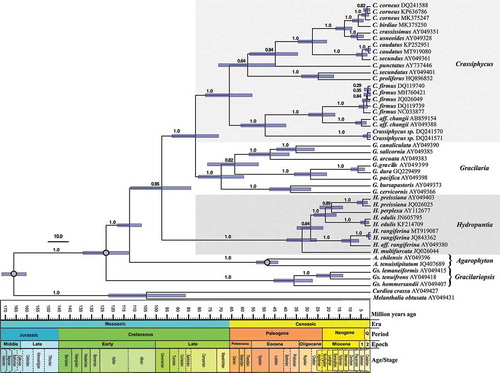
Fig. 2. Time-calibrated Bayesian phylogenetic tree of the genera Crassiphycus, Hydropuntia and other closely related Gracilariaceae based on rbcL DNA sequences. Numbers above the branches correspond to posterior probabilities (PP). Analysis employed a Yule speciation model and a strict molecular clock model. Time scale in million of years before present. Calibration nodes marked with grey circles were derived from Nan et al. (Citation2017, fig. 5A). Bars at nodes represent the 95% highest posterior density interval for each most recent common ancestor age. Scale bar in millions of years before present. Period Q = Quaternary; Epoch 1 = Pliocene; Epoch 2 = Pleistocene
Figs 3–9. Habit and anatomical morphology of Crassiphycus secundus. Figs 3–5. Range of habit variation and degree of branching. Fig. 3. Crassiphycus secundus type deposited in BM. Fig. 4. Voucher specimen from Capron Shoal, Fort Pierce, Florida, USA (LAF 07.98; rbcL GenBank accession number: AY049356). Fig. 5. Voucher specimen depicting a drift specimen collected at the beach behind Harbor Branch Oceanographic Institution, Indian River, Fort Pierce, Florida, USA (LAF 07.18.98.01.01; rbcL GenBank accession number: AY049361). Figs 6–9. Cross section from specimens collected in Cockroach Bay, Tampa Bay area, Florida, USA (LAF 26.10.99.01.04; rbcL GenBank accession number: AY049360). Fig. 6. Cross section showing gradual cell size transition between cortex and medulla. Fig. 7. Cross section showing detail of the transition between cortex and medulla, note extensive amount of floridean starch. Fig. 8. Cross section showing detail of cortical cells with oblique division of outer cortical cells (arrow). Fig. 9. Cross section showing mature cruciately divided tetrasporangium (arrow). Scale bars = 2 cm (Fig. 3), 4 cm (Fig. 4), 0.5 cm (Fig. 5), 100 µm (Fig. 6), 40 µm (Figs 7 & 9), 4.5 µm (Fig. 8)
Figs 10–11. Habit variation of Crassiphycus usneoides subsp. usneoides. Fig. 10. Holotype specimen of Crassiphycus usneoides deposited in LD. Fig. 11. Voucher specimen from Santa Rosalia bridge, Campeche Bay, Mexico (LAF 14.02.99.02.02; rbcL GenBank accession number: AY049349). Scale bars = ruler is in cm (Fig. 10), 1 cm (Fig. 11)
Figs 12–22. Anatomical features of Crassiphycus usneoides. Fig. 12. Surface view of cortex depicting variation in elliptical to irregularly shaped cortical cells and presence of large, circular glandular cortical cell flanked by smaller cortical cells. Fig. 13. Transverse section through the mid-portion of the thallus showing gradual transition between cortical and medullary cells in terms of their cell sizes. Fig. 14. Transverse section showing elongated tear-shaped cortical cells, with cells stretching at the region of their primary-pit connections, between cortical and sub-cortical cells. Details of thickened cell walls. Fig. 15. Transverse section showing detail of a glandular cortical cell and a trichocyte (arrow) bearing short hair-like extension. Fig. 16. Transverse section showing lenticular thickening of medullary cells forming interstitial cellular spaces. Fig. 17. Transverse section showing irregular roundish smaller medullary cells filling the space inside older medullary cells. Fig. 18. Transverse section through the cystocarp showing thick pericarp, pericarp ostiole, and initial phases of cystocarp development at the base of the cystocarp. Fig. 19. Transverse section through the cystocarp showing details of pericarp cell shape and organization. Detail of lenticular shape of the cuticle. Fig. 20. Transverse section through the base of the cystocarp showing nutritive tubular cells connecting gonimoblast cells to the gametophytic cells of the cystocarp floor. Fig. 21. Transverse section through the cystocarp showing detail of the carposporophyte, gonimoblasts irradiating from a small fusion cell, ip = inner pericarp composed of small gametophytic cells. Fig. 22. Transverse section through tetrasporophytic thallus showing tetrasporangia scattered across cortex, and thick cuticle. Scale bars = 4.5 µm (Figs 12, 14–16), 50 µm (Figs 17, 19–20, 2), 100 µm (Fig. 13), 200 µm (Figs 18, 21)
Figs 23–24. Habit variation of Crassiphycus usneoides subsp. succosus. Both specimens are from Santa Rosalia bridge, Campeche Bay, Mexico. Fig. 23. Voucher specimen LAF 14.02.99.02.01B. (rbcL GenBank accession number: AY049349). Fig. 24. Voucher specimen LAF 14.02.99.02.01A (rbcL GenBank accession number: AY049346). Scale bars: 1 cm (Figs 23–24)
Figs 25–30. Habit and morphology of Hydropuntia rangiferina. Figs 25–28. Habit variation. Fig. 25. Isotype specimen deposited in LD, LD 29499. Fig. 26. Voucher specimen from ES, Brazil (SP 469736; rbcL GenBank accession number: MK375244). Fig. 27. Voucher specimen from ES, Brazil (SP 469739; rbcL GenBank accession number: MK375245). Fig 28. Voucher specimen from Two-Mile Reef, Sodwana, KwaZulu Natal, South Africa (LAF 02.10.01.02.13; rbcL GenBank accession number: MT919087). Fig. 29. Cortical cells in surface view, arrows point to glandular cells. Fig. 30. Cross section showing medulla anatomy and gradual transition in cell size between medulla and cortex. Fig. 31. Cross section showing detail of cortical and subcortical cells. Scale bars = ruler on the image is in cm (Fig. 25), 1 cm (Figs 26–28), 25 µm (Fig. 29), 100 µm (Fig. 30), 25 µm (Fig. 31)