Figures & data
Table 1. The composition of TAP media and nitrogen deficient media
Figure 1. Comparison of physiological and biochemical indicators of P_KND (Parachlorella kessleri nitrogen deficient), and P_KC (P. kessleri control) over 7 days of cultivation. (a) Dry weight (bar graph) and neutral lipid content (line). (b) chlorophyll content (bar graph) and photochemical efficiency of photosystem II (Fv/Fm) (line). Data are shown as mean ± SE, n = 3
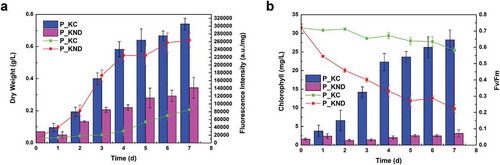
Table 2. Biochemical indicators of P_KND (nitrogen deficient) and P_KC (control) at day 0 and day 7 of cultivation
Table 3. The fatty acid compositions of P_KND and P_KC on day 7
Table 4. The output of transcriptome sequencing of Parachlorella kessleri TY
Table 5. Splicing length distribution of unigenes in Parachlorella kessleri TY
Figure 2. Differential gene expression patterns in P_KND and P_KC. (a) Density distribution of FPKM in P_KND and P_KC. (b) Volcano plot of differential gene expression in P_KND and P_KC. (c) Enrichment distribution point diagram of KEGG pathway in P_KND and P_KC
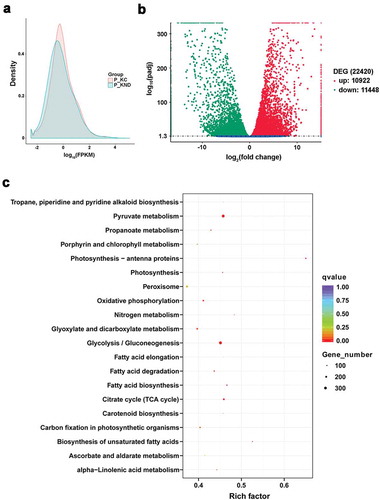
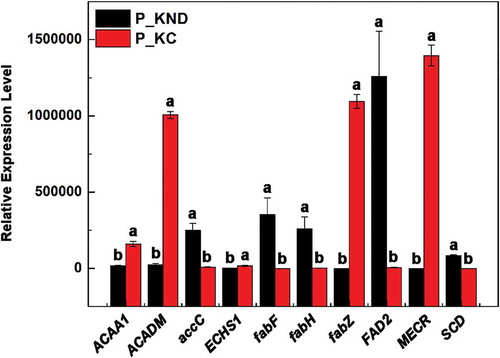
Figure 3. Quantification of the expression levels of lipid metabolism related genes in Parachlorella kessleri TY under P_KND and P_KC by RT-qPCR analysis. Data are shown as mean ± SD, n = 3, with superscript letters indicating significance (p < 0.05)