Figures & data
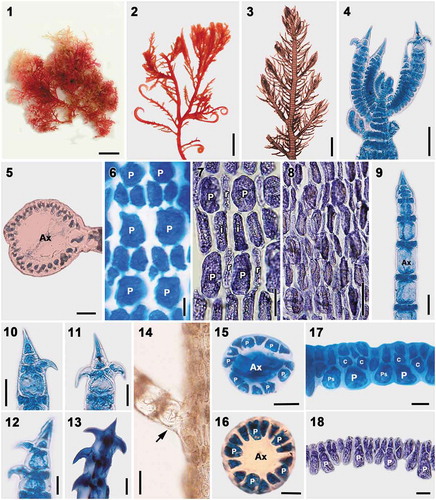
Figs 1–18. Vegetative structures of Spyridia aculeata. Fig. 1. Vegetative thallus. Fig. 2. Upper thallus part showing hooked indeterminate branches. Fig. 3. Upper thallus part showing indeterminate branches pattern. Fig. 4. Apex of young thallus. Fig. 5. Cross-section of main axis. Fig. 6. Cortication pattern of indeterminate branches in upper part of thallus. Fig. 7. Cortication pattern of indeterminate branches in middle part of thallus. Fig. 8. Cortication pattern of indeterminate branches in bottom part of thallus. Figs 9–13. Spine shapes at apex of determinate branches. Fig. 14. Intersection point of determinate branch on main axis lacking cortication (arrow). Figs 15–16. Cross-section of determinate branch. Figs 17–18. Cortication of determinate branch with only acropetal filament. Scale bars: Figs 1, 2 = 0.5 cm; Fig. 3 = 0.5 mm; Fig. 4 = 40 µm; Fig. 5 = 50 µm; Figs 6, 16 = 5 µm; Figs 7–9, 14 = 25 µm; Figs 10–13, 15 = 20 µm; Figs 17–18 = 10 µm
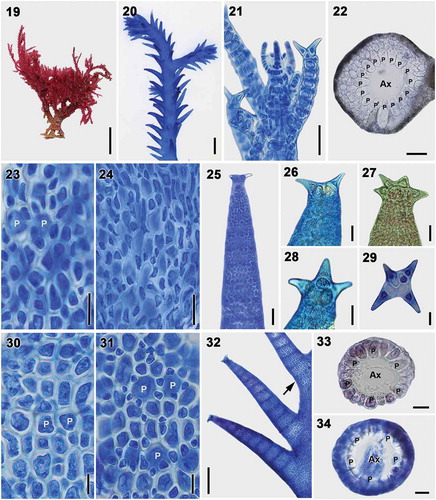
Figs 19–34. Vegetative structures of Spyridia cupressina. Fig. 19. Vegetative thallus. Fig. 20. Upper thallus part showing indeterminate branches. Fig. 21. Apex of young thallus. Fig. 22. Cross-section of the main axis. Fig. 23. Cortication pattern of indeterminate branches in upper part of thallus. Fig. 24. Cortication pattern of indeterminate branches in middle part of thallus. Figs 25–29. Spine shapes at apex of determinate branches. Figs 30–31. Cortication pattern of determinate branches. Fig. 32. Intersection point of determinate branch on main axis having complete cortication (arrow). Figs 33–34. Cross-section of determinate branch. Scale bars: Fig. 19 = 1 cm; Fig. 20 = 500 µm; Figs 21–22, 24–25 = 50 µm; Figs 23, 30–31, 33–34 = 25 µm; Figs 26–29 = 20 µm; Fig. 32 = 200 µm
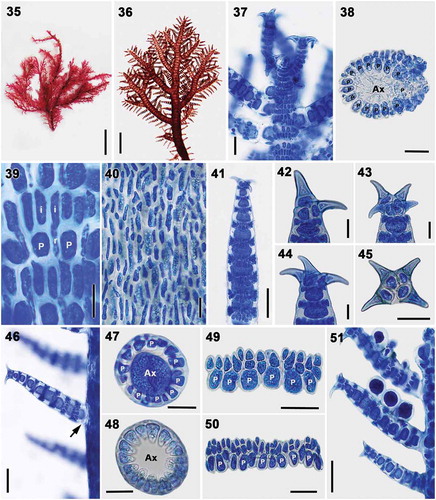
Figs 35–51. Vegetative structures of Spyridia horridula. Fig. 35. Vegetative thallus. Fig. 36. Upper thallus part showing indeterminate branching pattern. Fig. 37. Apex of young thallus. Fig. 38. Cross-section of main axis. Fig. 39. Cortication pattern of indeterminate branches in upper part of thallus. Fig. 40. Cortication pattern of indeterminate branches in middle part of thallus. Figs 41–45. Spine shapes at apex of determinate branches. Fig. 46. Intersection point of determinate branch on main axis lacking cortication (arrow) Figs 47–48. Cross-section of determinate branch. Figs 49–50. Cortication pattern of determinate branches with acropetal filament only. Fig. 51. Determinate branches with tetrasporangia. Scale bars: Fig. 35 = 1 cm; Fig. 36 = 0.5 mm; Figs 37–38, 46 = 50 µm; Figs 39–40, 42–45, 47–50 = 25 µm; Figs 41, 51 = 100 µm; Fig. 32 = 200 µm
Figs 52–68. Vegetative structures of Spyridia hypnoides. Fig. 52. Vegetative thallus. Fig. 53. Upper thallus part showing indeterminate branching pattern. Fig. 54. Apex of young thallus. Fig. 55. Cross-section of the main axis. Fig. 56. Cortication pattern of indeterminate branches in upper part of thallus. Fig. 57. Cortication pattern of indeterminate branches in middle part of thallus. Figs 58–62. Spine shapes at apex of determinate branches. Fig. 63. Intersection point of determinate branch on main axis becoming completely corticated (arrow). Figs 64–65. Cross-section of determinate branch. Figs 66–67. Cortication pattern of determinate branches with acropetal filament and basipetal filament. Fig. 68. Determinate branches with tetrasporangia. Scale bars: Fig. 52 = 1 cm; Fig. 53 = 0.5 mm; Fig. 54 = 10 µm; Fig. 55 = 100 µm; Fig. 56 = 5 µm; Figs 57, 63 = 50 µm; Figs 58–62, 64–68 = 25 µm
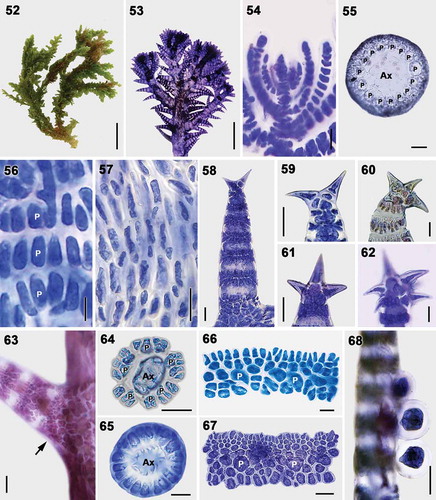
Fig. 69. Phylogenetic tree based on rbcL sequences. Values above branches denote the Maximum likelihood bootstrap values (BS) of > 50% or the Bayesian posterior probabilities (BPP) of > 0.75. BS values of < 50% and BPP values of < 0.75 are indicated by a hyphen (-). BS values of 100 and BPP values of 1 are indicated by *
Fig. 70. Phylogenetic tree based on the combined dataset with rbcL and LSU sequences. Values above branches denote the Maximum likelihood bootstrap values (BS) of > 50% or the Bayesian posterior probabilities (BPP) of > 0.75. BS values of < 50% and BPP values of < 0.75 are indicated by a hyphen (-). BS values of 100 and BPP values of 1 are indicated by *
Table 1. Comparisons (rbcL/LSU) of gene sequence divergence value (%) among Spyridia species with uncinate spines
Table 2. Comparison of principal morphological features in determinate branches among Spyridia species with uncinate spines
Figs 71–76. Vegetative structures of Spyridia alternans from the New York Botanical Garden (NY #922229). Fig. 71. Vegetative thallus. Fig. 72. Apex of young thallus with determinate branches. Fig. 73. Cortication pattern of determinate branch. Figs 74–75. Spine shapes at apex of determinate branches. Fig. 76. Intersection point of determinate branch on main axis lacking cortication (arrow). Scale bars: Fig. 71 = 2 cm; Fig. 72 = 100 µm; Figs 73–74, 76 = 25 µm; Fig. 75 = 20 µm
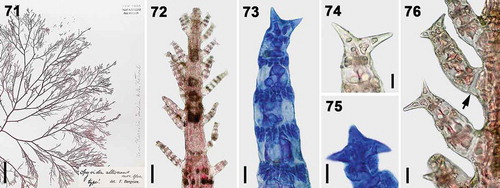
Fig. 77. Distributions of Spyridia aculeata (![]()