
Figures & data
Table 1. Partition scheme of 59 concatenated chloroplast protein-coding genes used in this study
Fig. 1. Phylogenetic tree of the Oedogoniales algae based on 18S rDNA sequences. Numbers on the left and right side at the branches represent ultrafast bootstrap inferred by IQTREE (≥ 50%) and Bayesian posterior probabilities (≥ 0.5), respectively. Branch lengths are proportional to the genetic distances, which are indicated by the scale bar
Fig. 2. Phylogenetic tree of the Oedogoniales algae based on ITS sequences. Numbers on the left and right side at the branches ultrafast bootstrap inferred by IQTREE (≥ 50%) and Bayesian posterior probabilities (≥ 0.5), respectively. Branch lengths are proportional to the genetic distances, which are indicated by the scale bar
Fig. 3. Phylogenetic tree based on 59 chloroplast genes was generated by the amino acid data sets. Numbers on the left and right side at the branches represent Bayesian posterior probabilities and bootstrap values, respectively. Scale bar indicates substitutions per site
Figs 4–12. Photos of habitat and light microscopy of four Oedocladium strains. Figs 4–7. O. prescottii. Fig. 4. O. prescottii collected from damp soil. Fig. 5. Branched filaments from nature showing growth habit including rhizoids and young oogonium. Fig. 6. Oogonium and oospore, showing conical apices and caps. Fig. 7. Recurved oogonium branches with recurved oogonium containing immature spores and hypogynous antheridia. Figs 8–12. O. carolinianum. Fig. 8. O. carolinianum collected from wet soil by the roadside. Fig. 9. Showing the oogonium and dwarf males. Fig. 10. Showing the three layers of the oogonium, with middle layer angulate. Fig. 11. Showing the inferior split of the oogonium. Fig. 12. Branched filaments from cultured. Scale bars: 20 μm
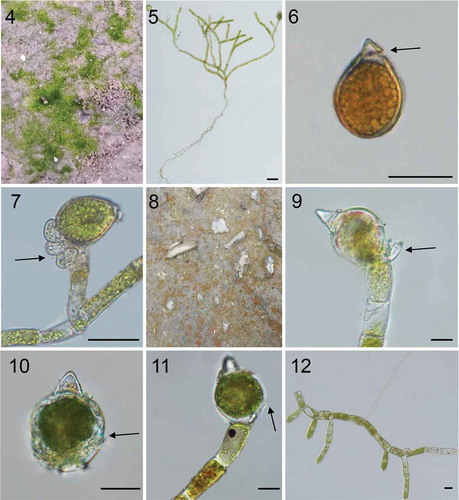
Fig. 13. Gene map of two Oedocladium chloroplast genomes: (a) – O. prescottii FACHB-2452; (b) –O. carolinianum FACHB-2453. Arrows show the direction of transcription. The same colour block shows the functional gene group (legend at bottom left). Transfer RNAs are represented by their one-letter amino acid code. The grey circle on the inside shows a graph of the GC content
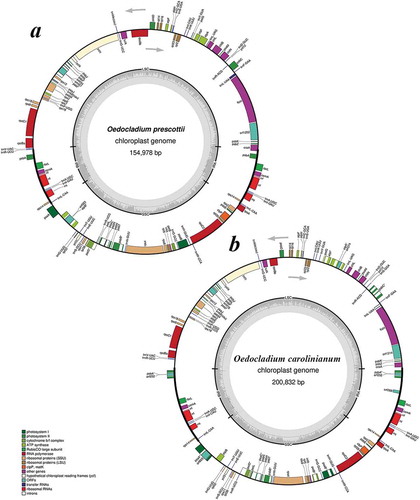
Fig. 14. Comparison of the IR-SC boundaries among four Oedogoniales species
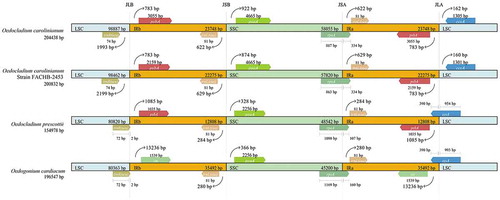
Fig. 15. Synteny comparison of Oedogoniales algae chloroplast genomes using progressive Mauve. The coloured syntenic blocks are local collinear blocks; blocks above the centre line indicate they are on the same strand, and blocks below the centre line indicate they are on the opposite strand
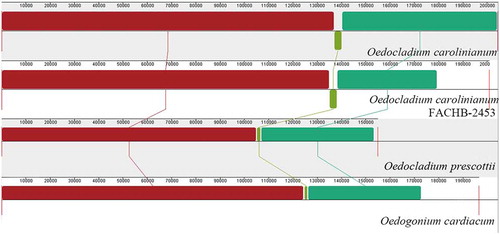
Table 2. General features of four Oedogonialean chloroplast genomes