Figures & data
Table 1. Demographic and laboratory characteristics of the study participants
Figure 1. Representation of possible SLCO1B1 allele/genotype combinations and their particular nucleotide composition
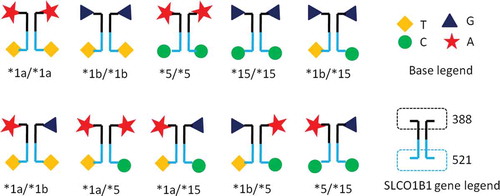
Table 2. Association between SLCO1B1 genotypes and serum lipids
Figure 2. Association of *1a/*1a,*1b/*1b,*1a/*1b and *1b/*15 genotypes and their triglycerides levels. *, P < 0.05. a P = 0.012, compared *1a/*1a with *1b/*1b groups. b P = 0.041, compared *1b/*1b * with *1a/*1b groups. The long and short black bars, mean and SD
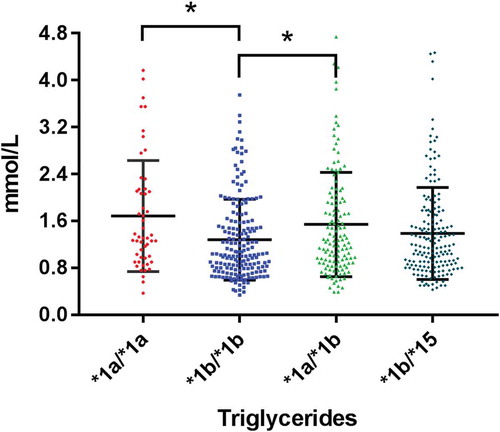
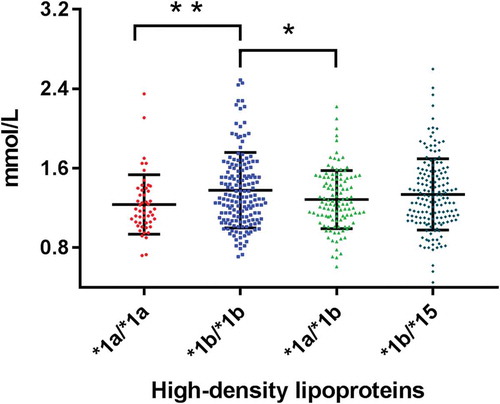
Figure 3. Association of *1a/*1a,*1b/*1b,*1a/*1b and *1b/*15 genotypes and their high-density lipoproteins levels. *, P < 0.05. **,P < 0.01, a P = 0.007, compared *1a/*1a with *1b/*1b groups.b P = 0.015, compared *1b/*1b * with *1a/*1b groups. The long and short black bars, Mean and SD