Figures & data
Table 1. Demographic characteristics of the total sample (N = 313).
Table 2. Psychedelic experiences of participants (N = 313).
Table 3. Frequency of experiences of discrimination from the M-GEDS (N = 313).
Table 4. Changes in symptoms before and after psychedelic experience (N = 313).
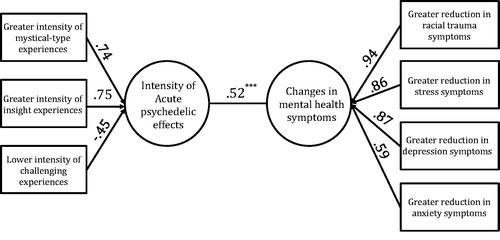
Figure 1. Canonical Correlation Analysis (N = 313), F20,1009 = 5.571, p < .001; correlation =.52. Variance explained: Set 1 (acute effects): .29; Set 2 (MH variables): .68. Control variables: Time since psychedelic experience occurred and frequency of ethnic discrimination prior to psychedelic experience. ***p<.001.