Figures & data
Table I. Sequence of the forward primers used in the JEN1 gene mutagenesis.
Figure 1. (A) Identification of the conserved sequence 379NXX[S/T]HX[S/T]QDXXXT391 (numbering refers to Jen1p) in the lactate/pyruvate:H+ symporter subfamily (TC#2.A.1.12.2). Multiple sequence alignment of Jen1p homologues available in the databases and the E. coli sialate transporter (NanT) was build by the Multalin (INRA) bioinformatics tool. (http://prodes.toulouse.inra.fr/multalin/multalin.html) (Corpet, Citation1988). (B) Predicted topology of Jen1p, built by the TMHMM software (http://www.cbs.dtu.dk/services/TMHMM-2.0/), with the location of the identified motif highlighted. The protein topology shown is composed of 12 transmembrane helices and cytoplasmic N- and C-tails.
![Figure 1. (A) Identification of the conserved sequence 379NXX[S/T]HX[S/T]QDXXXT391 (numbering refers to Jen1p) in the lactate/pyruvate:H+ symporter subfamily (TC#2.A.1.12.2). Multiple sequence alignment of Jen1p homologues available in the databases and the E. coli sialate transporter (NanT) was build by the Multalin (INRA) bioinformatics tool. (http://prodes.toulouse.inra.fr/multalin/multalin.html) (Corpet, Citation1988). (B) Predicted topology of Jen1p, built by the TMHMM software (http://www.cbs.dtu.dk/services/TMHMM-2.0/), with the location of the identified motif highlighted. The protein topology shown is composed of 12 transmembrane helices and cytoplasmic N- and C-tails.](/cms/asset/34073c92-afda-4be0-b8d8-7555b00f4aa6/imbc_a_234160_f0001_b.gif)
Figure 2. Evaluation of the uptake rate of labelled lactate (▴), pyruvate (▪) and acetate (▾) (60 µM final concentration), in the strain S. cerevisiae W303-1A pDS-1. Cells were cultivated in glucose until mid-exponential growth phase, washed and transferred to YNB lactic acid for 4 h.
Figure 3. Epifluorescence microscopy localization of Jen1-GFP fluorescence in (A) strain jen1Δ ady2Δ transformed with the plasmids pDS-1-GFP or pUG35 and (B) isogenic Jen1 mutant strains D3987H, D387A, H383K, H383D, N379A and N379Q. S. cerevisiae strains at mid-exponential growth phase were shifted under derepressed conditions for Jen1p expression (YNB lactate 0.5% (v/v), pH 5.0) for 4 h and observed under an epifluorescence microscope and in bright field. Additionally, for S. cerevisiaejen1Δ ady2Δ pUG35 strain methionine was added for repression conditions.
Figure 4. Relative transport rate of labelled lactate by the Jen1p mutants. The graphic represents the percentage of the initial uptake rate of the mutants considering that the initial uptake rate of the wild-type gene (pDS-1) was 100%.
Table II. Relative transport capacity (%) of lactate, pyruvate and acetate of the Jen1p mutants, compared to the wild-type (pDS-1).
Table III. Km values (mM) of Jen1p mutants for the uptake of lactate, acetate, and pyruvate.
Table IV. Ki values (mM) of Jen1p mutants for propionate, benzoate, salicylate and butyrate.
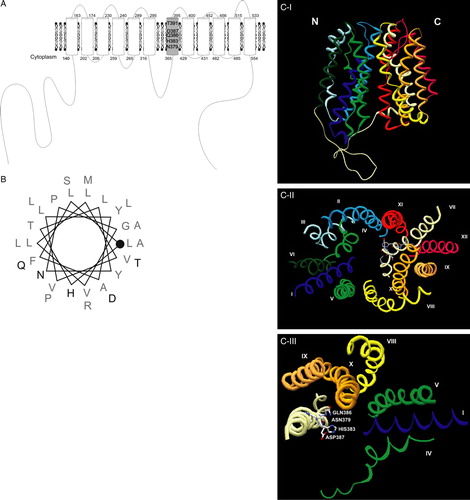
Figure 5. (A) Jen1p topology based on the HHpred (http://protevo.eb.tuebingen.mpg. de/toolkit/index.php?view=hhpred), showing highlighted the location of the identified motif within TMS7. (B) Schematic representation of TMS7 (LLFAYLVVLLVGPNYLTHASQDLLPTMLRA), illustrating the position of the amino acids in the helix; the beginning of TMS7 is represented with a closed circle and the studied domain is represented in bold (C) Ribbon representation of Jen1p structure modelled to the LacY permease (HHpred Modeller), (I) View parallel to the membrane; (II) View from the cytosol side (the loop regions are not represented); (III) simplified II view with indication of the residues studied in this work. Transmembrane domains are indicated from I to XII and from N to C terminus. The colour of each transmembrane domain is maintained in all of the Figures shown in colour in Molecular Membrane Biology online. Figures were prepared with program Swiss PDB viewer (Guex & Peitsch Citation1997).