Figures & data
Figure 1. Each cell type was analyzed for CD1.1 expression by incubation with 19G11 or isotype controls diluted at 5 µg/ml. After washing, cells were incubated with FITC-labeled goat anti rat IgG-Fc diluted at 10 µg/ml. Cells were washed, fixed and analyzed on a FACScalibur using Cellquest Software.
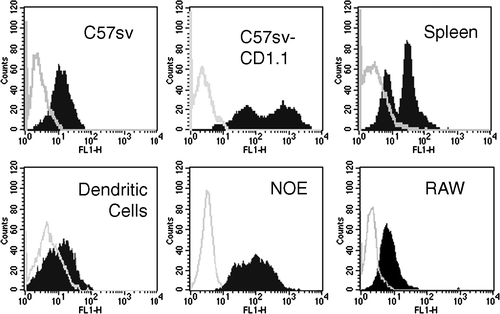
Figure 2. (A) For each cell type, 8×10⁴ cells were incubated with 8×10⁴ T cell hybridomas (DN32.D3, TB.A7 or TC.B11) for 24 h at 37°C in RPMI 1640 medium. Culture supernatants were collected 24 h later and IL-2 was measured. Dendritic cells, NOE cells line (8×10⁴) and DN32.D3 (B) or TC.B11 (C) (8×10⁴) were incubated with either the absence or the presence of α-GalCer (200 ng/ml) and with or without anti-CD1d 20H2 mAb (2 µg/ml). The reactivity of hybridomas was evaluated by IL-2 secretion (±SD from triplicates).
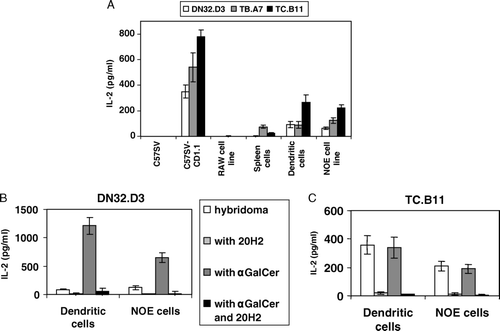
Figure 3. (A) Dendritic cells were treated with various concentrations of MβCD for 30 min, washed, incubated with DN32.D3, TB.A7 or TC.B11 hybridomas for 24 h and activation was measured by the IL-2 release. (B) Similar experiments were performed with three Vα14-positive hybridomas DN32.D3, P.41 and P.9 and the Vα14-negative hybridoma TC.B11 in the presence of α-GalCer (200 ng/ml). (C) The viability of dendritic cells was indirectly measured by the decrease of 3H incorporation. Results were expressed as% of inhibition of IL-2 production at various concentrations of MβCD as mean±SD from triplicates. (D) C57SV-CD1.1 cell line was treated with various concentrations of MβCD for 30 min, washed, incubated with DN32.D3, TB.A7 or TC.B11 hybridomas for 24 h and activation was measured by the IL-2 release. MβCD cytotoxicity was assessed by MTT test. Results were expressed as% of inhibition of IL-2 production at various MβCD concentrations and% of cellular viability as mean±SD from triplicates. In parallel, CD1d expression was assessed by flow cytometry with incubation of 19G11 mAb and FITC-labeled anti-rat antiserum and illustrated with the concentration of 30 mM of MβCD (insert).
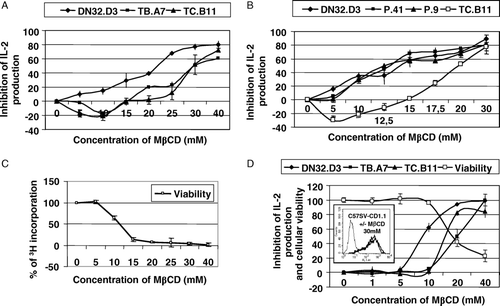
Figure 4. (A) C57SV-CD1.1 cell line and the NOE cell line were treated either with MβCD 10 mM for 30 min or α-GalCer (200 ng/ml) for 3 h. Cells were detached, post-nuclear supernatants were prepared in the presence of 1% Brij98 and loaded on Optiprep gradient and ultracentrifuged. The eight fractions were collected and the presence of CD1d and GM1 was analyzed by western-blot using either polyclonal anti-CD1d antiserum and peroxydase-labeled anti-rabbit antiserum or biotinylated cholera toxin and peroxydase-labeled streptavidin. The peroxydase activity was revealed with chemiluminescence. The levels of CD1d in each fraction were assessed by Image Master Software. (B) Fraction 2 from C57SV-CD1.1 cell line and dendritic cells were treated with N-Glycosidase F overnight at 37°C in presence of 0.2% SDS and 1% β-mercaptoethanol. Untreated and treated fractions were then analyzed by western-blot using anti-CD1d polyclonal antiserum, peroxydase-labeled anti-rabbit antiserum and revelation with chemiluminescence.
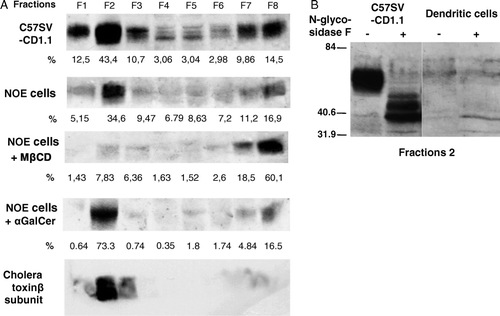
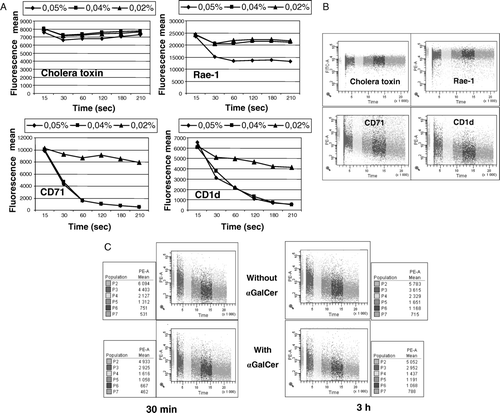
Figure 5. (A) Measurements of detergent solubility were performed in the flow cytometer kinetic mode data acquisition. NOE cell line were labeled during 15 min at 4°C with PE-anti-CD71, PE-anti-CD1d, PE-anti-Rae-1 or FITC-labeled cholera-toxin β subunit, washed and analyzed immediately. Labeled-cells were analyzed during 15 sec, mixed with the Triton X-100 (0.05, 0.04 or 0.02%) and then recorded for 4 min. Means of fluorescence for each Triton X-100 concentration and molecule were evaluated by FacsDiva software. (B) Results are illustrated with the concentration of 0.04%. (C) NOE cell line was treated in the presence of α-GalCer for 30 min and 3 h at 37°C. The detergent sensitivity of membrane CD1d was measured by flow cytometry kinetic mode data acquisition. NOE cell line was labeled during 15 min at 4°C with PE-anti-CD1d washed and analyzed immediately. Labeled-cells were analyzed during 15 sec, mixed with the Triton X-100 (0.04%) and then recorded for 4 min. Means of fluorescence are reported in the adjacent graphs.