622
Views
5
CrossRef citations to date
0
Altmetric
Original Article

Flow cytometric monitoring of multidrug drug resistance protein 1 (MRP1/ABCC1) -mediated transport of 2′,7′-bis-(3-carboxypropyl)-5-(and-6)- carboxyfluorescein (BCPCF) into human erythrocyte membrane inside-out vesicles

, , , &
Pages 485-495 | Received 09 Nov 2006, Published online: 09 Jul 2009

Figures & data

Figure 1.  Flow cytometric analysis of the homogeneity of the membrane vesicles preparations (top). (A) Forward scattering (FSC) histograms of E-IOVs indicating homogenous (bold solid line) and non-homogenous (solid line, filled curve) preparations. (B) Forward scattering (FSC) histograms of MRP1-Sf9-IOVs (bold solid line) and CTRL-Sf9-IOVs (solid line, filled curve). Determination of ATP-dependent BCPCF transport into membrane vesicles (bottom). Overlay of fluorescence intensity (FL-1) histograms for (C) E-IOVs incubated with 15 µM BCPCF for 60 min at 37°C and (D) MRP1-Sf9-IOVs incubated with 15 µM BCPCF for 30 min at 37°C. The ATP-dependent transport was calculated by subtraction of the MFI values of the histogram in the presence of ATP (bold solid line) and of the histogram in the presence of AMP (solid line). The plot of E-IOVs incubated in the presence of ATP (C) shows a typical profile that was similar in all preparations.
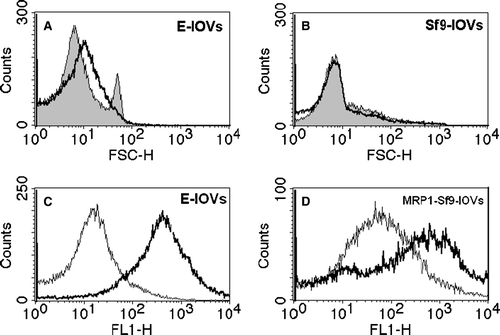
Figure 1.  Flow cytometric analysis of the homogeneity of the membrane vesicles preparations (top). (A) Forward scattering (FSC) histograms of E-IOVs indicating homogenous (bold solid line) and non-homogenous (solid line, filled curve) preparations. (B) Forward scattering (FSC) histograms of MRP1-Sf9-IOVs (bold solid line) and CTRL-Sf9-IOVs (solid line, filled curve). Determination of ATP-dependent BCPCF transport into membrane vesicles (bottom). Overlay of fluorescence intensity (FL-1) histograms for (C) E-IOVs incubated with 15 µM BCPCF for 60 min at 37°C and (D) MRP1-Sf9-IOVs incubated with 15 µM BCPCF for 30 min at 37°C. The ATP-dependent transport was calculated by subtraction of the MFI values of the histogram in the presence of ATP (bold solid line) and of the histogram in the presence of AMP (solid line). The plot of E-IOVs incubated in the presence of ATP (C) shows a typical profile that was similar in all preparations.

Figure 2.  Inhibition of ATP-dependent BCPCF transport into erythrocyte membrane inside-out vesicles by cyclosporin A. E-IOVs were incubated with 5 µM BCPCF for 60 min at 37°C in the absence (control) and in the presence of cyclosporin A (CsA) for flow cytometric analysis. Fluorescence (FL-1) histograms in the presence of ATP for control (bold solid line) and for CsA concentrations of 2 µM (solid line) and 10 µM (dotted line) and in the presence of AMP (dotted lines, filled curves) are shown as an overlay graph. This experiment is representative of three independent experiments.

Figure 2.  Inhibition of ATP-dependent BCPCF transport into erythrocyte membrane inside-out vesicles by cyclosporin A. E-IOVs were incubated with 5 µM BCPCF for 60 min at 37°C in the absence (control) and in the presence of cyclosporin A (CsA) for flow cytometric analysis. Fluorescence (FL-1) histograms in the presence of ATP for control (bold solid line) and for CsA concentrations of 2 µM (solid line) and 10 µM (dotted line) and in the presence of AMP (dotted lines, filled curves) are shown as an overlay graph. This experiment is representative of three independent experiments.

Figure 3.  ATP-dependent transport of BCPCF into inside-out erythrocyte membrane vesicles. E-IOVs were incubated with BCPCF (5 µM) at 37°C. The ATP-dependent transport of BCPCF (⋄) was calculated as the difference of BCPCF accumulation measured by flow cytometry in the presence of ATP (▪) and in the presence of AMP (□). Median of the histogram fluorescence intensity was taken as a measure of the BCPCF accumulation of the sample. Values are the mean±SD of triplicate determinations in a single experiment. Two additional experiments for vesicles prepared from the blood of the other donors show similar results.

Figure 3.  ATP-dependent transport of BCPCF into inside-out erythrocyte membrane vesicles. E-IOVs were incubated with BCPCF (5 µM) at 37°C. The ATP-dependent transport of BCPCF (⋄) was calculated as the difference of BCPCF accumulation measured by flow cytometry in the presence of ATP (▪) and in the presence of AMP (□). Median of the histogram fluorescence intensity was taken as a measure of the BCPCF accumulation of the sample. Values are the mean±SD of triplicate determinations in a single experiment. Two additional experiments for vesicles prepared from the blood of the other donors show similar results.

Figure 4.  Kinetics of ATP-dependent BCPCF transport into inside-out erythrocyte membrane vesicles. (A) The rate of BCPCF accumulation into E-IOVs was measured with varying BCPCF concentrations (1–15 µM) for 60 min at 37°C in the presence of ATP (▪) and in the presence of AMP (□). (B) The calculated rate of ATP-dependent transport of fluorophore into vesicles shown in A (⋄), and data for E-IOVs prepared from the blood of another donor (▴), are plotted. Kinetic constants Km and Vmax for BCPCF transport were determined using nonlinear fitting to the hyperbolic Michaelis-Menten equation. Each value in A and B is the mean±SD of three independent calibrated experiments made in duplicate.
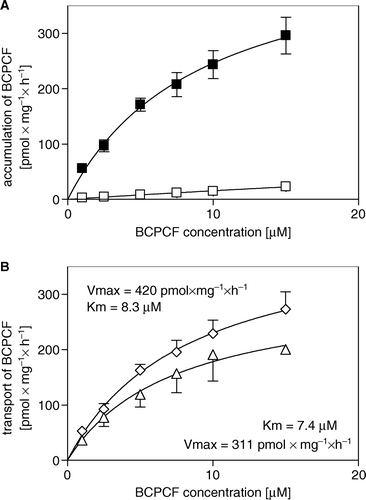
Figure 4.  Kinetics of ATP-dependent BCPCF transport into inside-out erythrocyte membrane vesicles. (A) The rate of BCPCF accumulation into E-IOVs was measured with varying BCPCF concentrations (1–15 µM) for 60 min at 37°C in the presence of ATP (▪) and in the presence of AMP (□). (B) The calculated rate of ATP-dependent transport of fluorophore into vesicles shown in Figure 4A (⋄), and data for E-IOVs prepared from the blood of another donor (▴), are plotted. Kinetic constants Km and Vmax for BCPCF transport were determined using nonlinear fitting to the hyperbolic Michaelis-Menten equation. Each value in Figure 4A and 4B is the mean±SD of three independent calibrated experiments made in duplicate.

Table I.  Kinetic constants Km and Vmax for ATP-dependent BCPCF transport into erythrocyte membrane inside-out vesicles.

Figure 5.  Kinetics of ATP-dependent BCPCF transport into inside-out Sf9 cell membrane vesicles. (A) MRP1-Sf9-IOVs (▪, □) and CTRL-Sf9-IOVs (•, ○) were exposed for 30 min to various concentrations of BCPCF (1–25 µM) in the presence of either ATP (▪, •) or AMP (□, ○). Each data point is the mean value of duplicate determinations of the accumulation in a single experiment. Similar results were obtained in one additional independent experiment. (B) Kinetic constants Km and Vmax for BCPCF transport were determined using nonlinear fitting to the hyperbolic Michaelis-Menten equation. ATP-dependent transport values calculated (see legend to ) from data shown in A for MRP1-Sf9-IOVs (▪) and CTRL-Sf9-IOVs (•) are plotted.
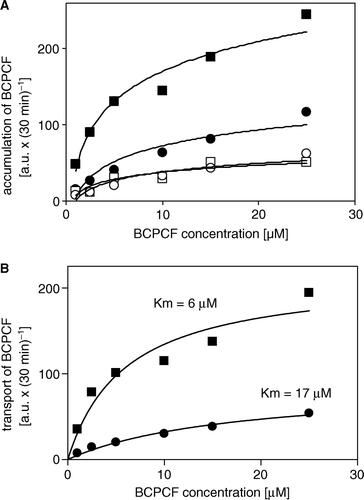
Figure 5.  Kinetics of ATP-dependent BCPCF transport into inside-out Sf9 cell membrane vesicles. (A) MRP1-Sf9-IOVs (▪, □) and CTRL-Sf9-IOVs (•, ○) were exposed for 30 min to various concentrations of BCPCF (1–25 µM) in the presence of either ATP (▪, •) or AMP (□, ○). Each data point is the mean value of duplicate determinations of the accumulation in a single experiment. Similar results were obtained in one additional independent experiment. (B) Kinetic constants Km and Vmax for BCPCF transport were determined using nonlinear fitting to the hyperbolic Michaelis-Menten equation. ATP-dependent transport values calculated (see legend to Figure 3) from data shown in Figure 5A for MRP1-Sf9-IOVs (▪) and CTRL-Sf9-IOVs (•) are plotted.

Figure 6.  Effect of the MRP1-specific antibodies QCRL-3 and QCRL-1 and of the MRP-specific inhibitor MK-571 on BCPCF transport into the lumen of inside-out membrane vesicles. The influence of modulators on ATP-dependent BCPCF (5 µM) transport into E-IOVs (60 min) and Sf9-IOVs (30 min) are shown in A, B, C and in D, respectively. Results are expressed as a percentage of control (in the absence of modulators). (A) Concentration dependent inhibition by the monoclonal MRP1-specific antibody QCRL-3 and (B) by the MRP-specific inhibitor MK-571. Bars represent the mean±SD of three experiments done in duplicate on preparations from different blood donors. (C) The effects of monoclonal MRP1-specific antibody QCRL-1 (4 µg/ml), sucrose (1 M), or Triton X-100 (0.02%). Bars represent the mean of two experiments done in duplicate. (D) The effects of QCRL-3 (4 µg/ml), QCRL-1 (4 µg/ml), sucrose (1 M), Triton X-100 (0.02%) and MK-571 (2 µM) on ATP-dependent transport into CTRL-Sf9-IOVs (grey bars) and MRP1-Sf9-IOVs (black bars). Bars represent the mean±SD (of three experiments done in duplicate) or the mean (of two experiments done in duplicate). Significant difference from control calculated with Student's t-test; *p < 0.05, **p < 0.01.

Figure 6.  Effect of the MRP1-specific antibodies QCRL-3 and QCRL-1 and of the MRP-specific inhibitor MK-571 on BCPCF transport into the lumen of inside-out membrane vesicles. The influence of modulators on ATP-dependent BCPCF (5 µM) transport into E-IOVs (60 min) and Sf9-IOVs (30 min) are shown in Figure 6A, 6B, 6C and in Figure 6D, respectively. Results are expressed as a percentage of control (in the absence of modulators). (A) Concentration dependent inhibition by the monoclonal MRP1-specific antibody QCRL-3 and (B) by the MRP-specific inhibitor MK-571. Bars represent the mean±SD of three experiments done in duplicate on preparations from different blood donors. (C) The effects of monoclonal MRP1-specific antibody QCRL-1 (4 µg/ml), sucrose (1 M), or Triton X-100 (0.02%). Bars represent the mean of two experiments done in duplicate. (D) The effects of QCRL-3 (4 µg/ml), QCRL-1 (4 µg/ml), sucrose (1 M), Triton X-100 (0.02%) and MK-571 (2 µM) on ATP-dependent transport into CTRL-Sf9-IOVs (grey bars) and MRP1-Sf9-IOVs (black bars). Bars represent the mean±SD (of three experiments done in duplicate) or the mean (of two experiments done in duplicate). Significant difference from control calculated with Student's t-test; *p < 0.05, **p < 0.01.

Figure 7.  The effect of various inhibitors on ATP-dependent BCPCF transport into human erythrocyte membrane inside-out vesicles. ATP-dependent transport of BCPCF (5 µM, 60 min, 37°C) in the presence of benzbromarone (BNB), verapamil (VER), and probenecid (PRO) is expressed as the percentage of the transport in the absence of inhibitors (control). The values of concentration-dependent inhibition are the mean±SD of duplicate determination in three experiments (each performed on E-IOVs preparation from the blood of a different donor). Significant difference from control calculated with Student's t-test; *p < 0.01, **p < 0.001.

Figure 7.  The effect of various inhibitors on ATP-dependent BCPCF transport into human erythrocyte membrane inside-out vesicles. ATP-dependent transport of BCPCF (5 µM, 60 min, 37°C) in the presence of benzbromarone (BNB), verapamil (VER), and probenecid (PRO) is expressed as the percentage of the transport in the absence of inhibitors (control). The values of concentration-dependent inhibition are the mean±SD of duplicate determination in three experiments (each performed on E-IOVs preparation from the blood of a different donor). Significant difference from control calculated with Student's t-test; *p < 0.01, **p < 0.001.

Figure 8.  Inhibition of ATP-dependent BCPCF transport into erythrocyte membrane inside-out vesicles by benzbromarone and verapamil. ATP-dependent BCPCF transport was determined from uncalibrated flow cytometric measurements at various substrate concentrations (1–15 µM) for 60 min in the absence (▪) or in the presence of 5 µM benzbromarone (○) and in the presence of 10 µM verapamil (Δ). Data were plotted from a single experiment in duplicate and the kinetic constants Km and Vmaxrel were calculated using nonlinear fitting to the hyperbolic equation. Similar results were obtained in two additional experiments done with E-IOVs preparations from the blood of the other donors. Summarized results are shown in .

Figure 8.  Inhibition of ATP-dependent BCPCF transport into erythrocyte membrane inside-out vesicles by benzbromarone and verapamil. ATP-dependent BCPCF transport was determined from uncalibrated flow cytometric measurements at various substrate concentrations (1–15 µM) for 60 min in the absence (▪) or in the presence of 5 µM benzbromarone (○) and in the presence of 10 µM verapamil (Δ). Data were plotted from a single experiment in duplicate and the kinetic constants Km and Vmaxrel were calculated using nonlinear fitting to the hyperbolic equation. Similar results were obtained in two additional experiments done with E-IOVs preparations from the blood of the other donors. Summarized results are shown in Table II.

Table II.  Effect of inhibitors on the kinetic constants Km and Vmax for BCPCF transport into erythrocyte membrane inside-out vesicles.

Figure 9.  Inhibition of ATP-dependent BCPCF transport into erythrocyte membrane inside-out vesicles by MK-571 (A) and cyclosporin A (B). The ATP-dependent BCPCF transport was determined from calibrated flow cytometric measurements at various substrate concentrations (1–15 µM) for 60 min at 37°C in the absence (▪, A and B) or in the presence of 1 µM MK-571 (○, A) and in the presence of 2 µM CsA (Δ, B). Data were plotted from a single experiment in duplicate and the kinetic constants Km and Vmax were calculated using nonlinear fitting to the hyperbolic equation. Similar results were obtained in two additional experiments done on E-IOVs from the blood of the other donors. Summarized results are shown in . Vmax determined for the controls were 176 pmol×mg−1×h−1 and 191 pmol×mg−1×h−1 in the A and B, respectively.

Figure 9.  Inhibition of ATP-dependent BCPCF transport into erythrocyte membrane inside-out vesicles by MK-571 (A) and cyclosporin A (B). The ATP-dependent BCPCF transport was determined from calibrated flow cytometric measurements at various substrate concentrations (1–15 µM) for 60 min at 37°C in the absence (▪, A and B) or in the presence of 1 µM MK-571 (○, A) and in the presence of 2 µM CsA (Δ, B). Data were plotted from a single experiment in duplicate and the kinetic constants Km and Vmax were calculated using nonlinear fitting to the hyperbolic equation. Similar results were obtained in two additional experiments done on E-IOVs from the blood of the other donors. Summarized results are shown in Table II. Vmax determined for the controls were 176 pmol×mg−1×h−1 and 191 pmol×mg−1×h−1 in the Figure 9A and 9B, respectively.

Reprints and Corporate Permissions

Please note: Selecting permissions does not provide access to the full text of the article, please see our help page How do I view content?

To request a reprint or corporate permissions for this article, please click on the relevant link below:

Academic Permissions

Please note: Selecting permissions does not provide access to the full text of the article, please see our help page How do I view content?

Obtain permissions instantly via Rightslink by clicking on the button below:

If you are unable to obtain permissions via Rightslink, please complete and submit this Permissions form. For more information, please visit our Permissions help page.