Figures & data
Figure 1. (A) Ribbon representation of AqpZ tetramer, viewed from the periplasmic side down the tetramer four-fold axis (diamond). One monomer is colored in both cyan and yellow, representing the N- and C-terminal halves that are related by a quasi-two-fold axis (red dashed line). (B) Membrane topology of AQP. Two genetic repeats (Repeat-1 and Repeat-2) are colored in cyan and yellow respectively. Membrane-spanning helices are denoted as I-VI, loops A-E, and the NPA signature sequences are labeled. (C) AqpZ monomer viewed from the membrane plane. Two repeats are colored and transmembrane spanning helices labeled as above. (D) Pore-lining carbonyl oxygens and asparagine amines in AQP1. The boundary of the water-conducting channel, as estimated by HOLE (Smart, Goodfellow & Wallace 1993), is represented as a red meshed tube. Two patches of carbonyl oxygens and two central asparagine amines are indicated by red and blue arrows respectively. All figures were rendered with PyMol.
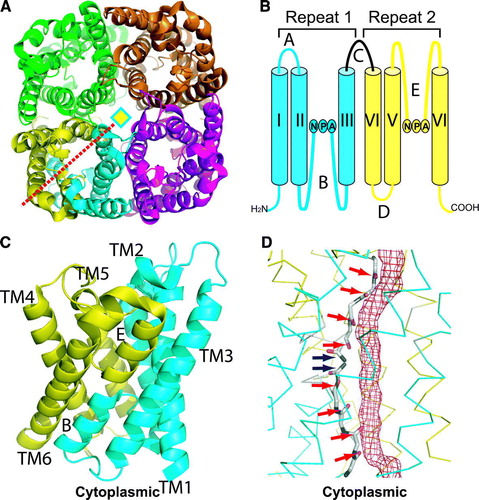
Figure 2. (A–C) ar/R constriction sites of AQP1 (A), GlpF (B) and AqpM (C), viewed from the extracellular side down the channel. A water (W) or glycerol (G) molecule is bound at the center of the ar/R constriction with coordination residues labeled. D-E, NPA junctions of AQP1 (D) and GlpF (E) with coordinated waters (W) or glycerol (G). Dashed lines indicate hydrogen bonds.
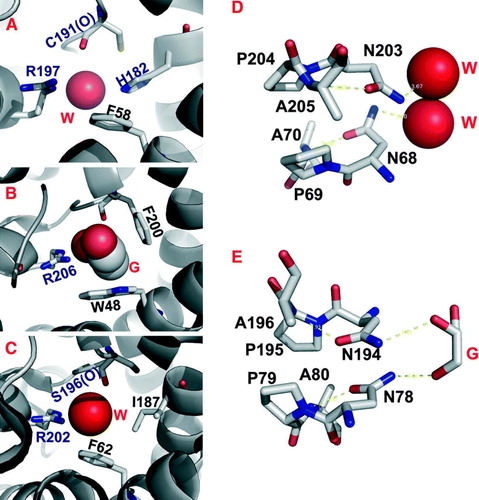
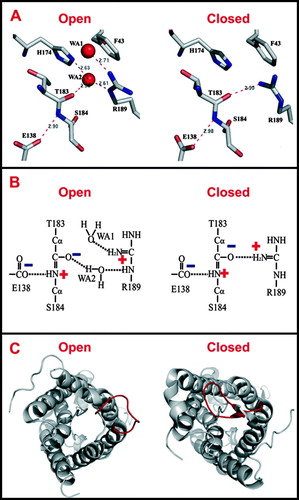
Figure 3. (A) Hydrogen bond network in the ar/R constriction of an open or closed AqpZ channel. (B) The electrostatic interaction between R189 and E138 and its contribution to the dual polarization of the bound water molecule (Jiang et al. Citation2006). (C) Open and closed conformations of the SoPIP2;1 structure, viewed from the cytoplasmic side down the water channel. The major difference between these two conformations is the displacement of the cytoplasmic loop D (red) that blocks the channel entrance in the closed conformation.