1,100
Views
5
CrossRef citations to date
0
Altmetric
Original Article

Gene expression profiling, chromosome assignment and mutational analysis of the porcine Golgi-resident UDP-N-Acetylglucosamine transporter SLC35A3

, , , , &
Pages 519-530 | Received 07 Nov 2006, Published online: 09 Jul 2009

Figures & data

Figure 1.  Expression profile of the porcine SLC35A3 mRNA in various tissues. (a) Amplicons from RT-PCR analysis were visualized on ethidium bromide stained 2% TBE agarose gel. SLC35A3 specific primers amplified a product of size 192 bp compared to the 110 bp amplicon of 18S-rRNA. DNA marker was loaded in the first lane followed by a negative control without cDNA template. The sample names are listed above their respective lanes. (b) Real-time RT-PCR data illustrating the relative expression of porcine SLC35A3 mRNA in lung, vastus intermedius, stomach, fat and heart from three individuals. The data were normalized to the amounts of 18S-rRNA.
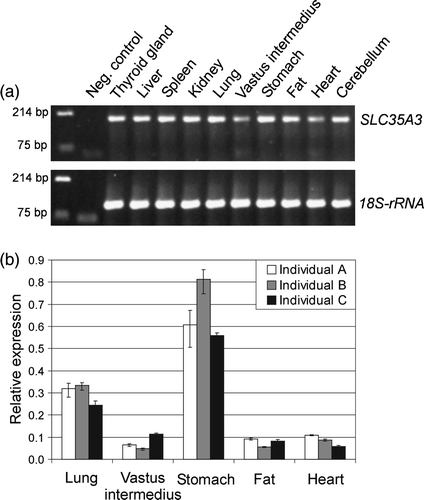
Figure 1.  Expression profile of the porcine SLC35A3 mRNA in various tissues. (a) Amplicons from RT-PCR analysis were visualized on ethidium bromide stained 2% TBE agarose gel. SLC35A3 specific primers amplified a product of size 192 bp compared to the 110 bp amplicon of 18S-rRNA. DNA marker was loaded in the first lane followed by a negative control without cDNA template. The sample names are listed above their respective lanes. (b) Real-time RT-PCR data illustrating the relative expression of porcine SLC35A3 mRNA in lung, vastus intermedius, stomach, fat and heart from three individuals. The data were normalized to the amounts of 18S-rRNA.

Figure 2.  Hydrophobicity plot of the porcine UDP-GlcNAc amino acid sequence. The plot was generated using the hydrophobicity values of Kyte and Doolittle with window size 15. The amino acid (aa) position is shown on the x-axis.
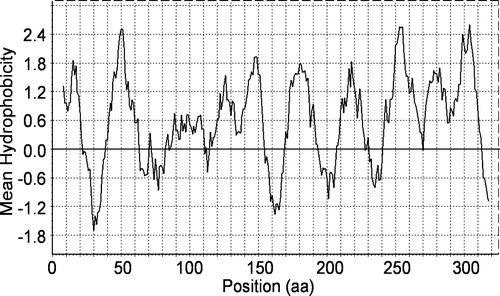
Figure 2.  Hydrophobicity plot of the porcine UDP-GlcNAc amino acid sequence. The plot was generated using the hydrophobicity values of Kyte and Doolittle with window size 15. The amino acid (aa) position is shown on the x-axis.

Table I.  HMMTOP transmembrane topology prediction of SLC35A3 (Tusnady & Simon Citation1998, Tusnady & Simon Citation2001).

Figure 3.  Comparison of the deduced amino acid sequence of the Golgi UDP-GlcNAc transporter from Sus scrofa to its orthologues in Bos Taurus (accession number: AAO22138), Canis familiaris (AAC39260), Homo sapiens (BAA77841), and Mus musculus (AAH24110). Dots indicate residues identical with the porcine sequence and dashes indicate gaps. Black boxes with white text indicate amino acid substitutions. A plus sign + or a minus sign − indicates the presence or absence of transporter activity; (–) indicates reduced activity. Grey bars denote transmembrane domains predicted on the HMMTOP server (Tusnady & Simon Citation1998, Tusnady & Simon Citation2001). Truncations and internal deletion regions are specified with black arrows.
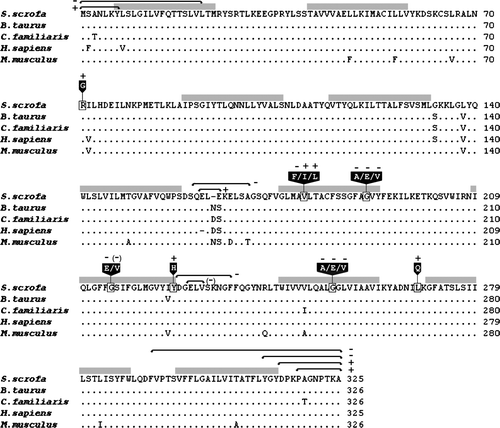
Figure 3.  Comparison of the deduced amino acid sequence of the Golgi UDP-GlcNAc transporter from Sus scrofa to its orthologues in Bos Taurus (accession number: AAO22138), Canis familiaris (AAC39260), Homo sapiens (BAA77841), and Mus musculus (AAH24110). Dots indicate residues identical with the porcine sequence and dashes indicate gaps. Black boxes with white text indicate amino acid substitutions. A plus sign + or a minus sign − indicates the presence or absence of transporter activity; (–) indicates reduced activity. Grey bars denote transmembrane domains predicted on the HMMTOP server (Tusnady & Simon Citation1998, Tusnady & Simon Citation2001). Truncations and internal deletion regions are specified with black arrows.

Figure 4.  Flow cytometry analysis of labelled Kluyveromyces lactis cells. The mnn2-2 mutant phenotype (KL3) is deficient in UDP-GlcNAc transport, which can be rescued to the level of the yeast wild-type strain MG½ by expression of the porcine wild-type SLC35A3 gene (WT). Yeast transformants were differentially labelled with FITC-conjugated wheat germ agglutinin (WGA), which recognizes terminal GlcNAc residues in cell surface glycans. FITC fluorescence signals are presented on a logarithmic scale on the horizontal axis and the vertical axis shows the counts. Various truncations/deletions/mutations as stated above the individual peak profile were tested in the assay. Yeast cells transformed with the pE4 vector were used as controls.
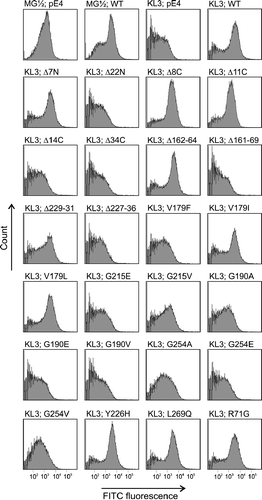
Figure 4.  Flow cytometry analysis of labelled Kluyveromyces lactis cells. The mnn2-2 mutant phenotype (KL3) is deficient in UDP-GlcNAc transport, which can be rescued to the level of the yeast wild-type strain MG½ by expression of the porcine wild-type SLC35A3 gene (WT). Yeast transformants were differentially labelled with FITC-conjugated wheat germ agglutinin (WGA), which recognizes terminal GlcNAc residues in cell surface glycans. FITC fluorescence signals are presented on a logarithmic scale on the horizontal axis and the vertical axis shows the counts. Various truncations/deletions/mutations as stated above the individual peak profile were tested in the assay. Yeast cells transformed with the pE4 vector were used as controls.

Figure 5.  Multiple alignments of related proteins in the subfamily SLC35A. Besides the UDP-N-acetylglucosamine transporter (SLC35A3; Accession numbers: DQ883629 and AAH24110), the alignment comprises amino acid sequences for the mammalian UDP-sialic acid (SLC35A1; AAI02766 and AAH12252) and UDP-galactose (SLC35A2; AAX46538 and AAH37701) transporters. Sus scrofa is abbreviated Sscr, Bos Taurus: Btau, and Mus musculus: Mmus. Black background indicates conserved residues among the three transporters, whereas grey background indicates similar residues. Arrowheads illustrate SLC35A3 mutations from the present work, and oval symbols illustrate mutations from studies of SLC35A1 and -A2 proteins (Eckhardt et al. Citation1998, Ishida et al. Citation1999b, Oelmann et al. Citation2001). Open symbols indicate maintained transport activity in contrast to filled symbols for inactive transporters.
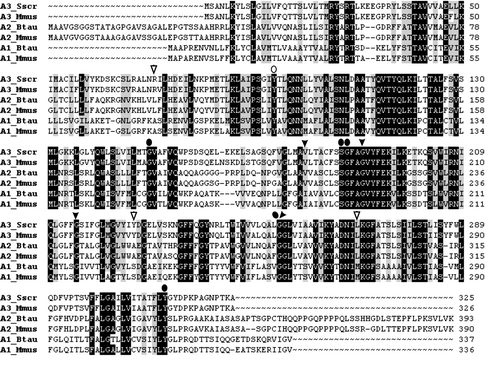
Figure 5.  Multiple alignments of related proteins in the subfamily SLC35A. Besides the UDP-N-acetylglucosamine transporter (SLC35A3; Accession numbers: DQ883629 and AAH24110), the alignment comprises amino acid sequences for the mammalian UDP-sialic acid (SLC35A1; AAI02766 and AAH12252) and UDP-galactose (SLC35A2; AAX46538 and AAH37701) transporters. Sus scrofa is abbreviated Sscr, Bos Taurus: Btau, and Mus musculus: Mmus. Black background indicates conserved residues among the three transporters, whereas grey background indicates similar residues. Arrowheads illustrate SLC35A3 mutations from the present work, and oval symbols illustrate mutations from studies of SLC35A1 and -A2 proteins (Eckhardt et al. Citation1998, Ishida et al. Citation1999b, Oelmann et al. Citation2001). Open symbols indicate maintained transport activity in contrast to filled symbols for inactive transporters.

Reprints and Corporate Permissions

Please note: Selecting permissions does not provide access to the full text of the article, please see our help page How do I view content?

To request a reprint or corporate permissions for this article, please click on the relevant link below:

Academic Permissions

Please note: Selecting permissions does not provide access to the full text of the article, please see our help page How do I view content?

Obtain permissions instantly via Rightslink by clicking on the button below:

If you are unable to obtain permissions via Rightslink, please complete and submit this Permissions form. For more information, please visit our Permissions help page.