Figures & data
Figure 1. The cingulin sequence is particularly well conserved in the ZIM and rod domains. Alignment of cingulin amino acid sequences from mouse (Accession no. P59242), rat (Accession no. XM_227472), human (Accession no. AF263462) and dog (Accession no. DQ910799) are shown. Boxed sequences correspond to the ZO-1 Interaction Motif (ZIM), and to the rod sequence region (Rod), which shows a predicted coiled-coil structure. Identical residues are highlighted in black.
Figure 2. Inducible overexpression and localization of GFP-tagged canine cingulin constructs in MDCK cells. Top panel (A) Immunofluorescence micrographs showing the localization of GFP (A, B), GFP-Full-length cingulin (C, D), GFP-head domain (E, F), GFP-rod + tail domains (G, H) in stably transfected clones either in the presence (+: A, C, E, G) or in the absence (−: B, D, F, H) of Dox. Nuclei are stained in blue by DAPI. Note that no GFP labeling is detectable in the presence of Dox, which represses transgene expression. Single arrows (D, F, H) indicate junctional labeling. Arrowheads (D, H) indicate cytoplasmic labeling. Bar = 10 µm. Bottom panel (B) Immunoblot analysis (with anti-ZO-1 and anti-myc antibodies, top and bottom, respectively) of myc immunoprecipitates obtained by incubating myc-tagged GST fusion proteins with anti-mouse Dynabeads, followed by washing and incubation with MDCK cell lysates. Lanes are indicated: input (lysate); beads (no GST fusion proteins); myc (GST-myc); GFP-Head-myc (GST fused to GFP-canine cingulin head-myc); Head-myc (GST fused to canine cingulin head-myc). Asterisks in the Myc immunoblot indicate recombinant, myc-tagged proteins. Other bands are due to non-specific cross-reactivities of the antibodies. Note that the ZO-1 immunoblots show essentially identical signal in the GFP-Head-myc and Head-myc lanes, indicating that the presence of the GFP moiety does not affect the interaction of the cingulin head with ZO-1. This figure is reproduced in colour in Molecular Membrane Biology online.
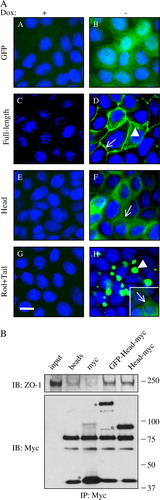
Figure 3. Overexpression of cingulin and its domains in stable MDCK clones does not result in changes in TJ protein levels and gene expression. (A) Immunoblot analysis of lysates from control MDCK cells, and stable clones expressing either GFP alone, or GFP fused to full-length canine cingulin, head, or rod + tail domains, in the presence (+) or absence (−) of Dox. Proteins are indicated on the left (CGN = cingulin, CLDN = claudin, OCLN = occludin). Numbers on the right correspond to the size (kDa) of prestained molecular weight markers. Note that antibodies against GFP label the exogeneous proteins, which are detected only upon induction of transgene expression, by removal of Dox. Images are representative of three independent experiments for each protein examined. The cingulin immunoblot shows smeared signals in the lanes containing overexpressed exogenous protein. (B) Dot-plot analysis of the normalized expression intensity (expressed in arbitrary units, proportional to the intensity of the fluorescence Affymetrix signal) of the 21,700 canine transcripts in one clone (Clone 2) of MDCK cells stably expressing full-length cingulin, either in the presence or in the absence of Dox. Each transcript is represented by a point. Dotted lines flanking the diagonal represent a 2-fold decrease (top) or increase (bottom) of relative gene expression, in samples without Dox. The four circled points represent transcripts showing >2-fold increase. Note that except for the 4 circled points, all other points are clustered along the diagonal, indicating that overexpression of full-length cingulin does not have major effects on the pattern of gene expression.
Figure 4. RhoA activity, cell density and doubling time are not affected by cingulin overexpression. (A) and (B) Immunoblot analysis showing active RhoA (isolated by a rhotekin-binding GST pulldown assay), versus total RhoA and tubulin protein levels, in lysates from MDCK clones expressing either GFP alone, or GFP fused to full-length canine cingulin, head, or rod + tail domains, cultured at 100% confluence (A) or at 50% confluence (B). Numbers on the right correspond to the size (kDa) of prestained molecular weight markers. Note that induction of transgene expression does not result in changes in the levels of active RhoA. (C) Histogram showing the fold-increase in cell density (number of cells in the absence of Dox/number of cells in the presence of Dox) in control MDCK cells, and in stable clones expressing either GFP alone, or GFP fused to full-length canine cingulin, head, or rod + tail domains. (D) Histogram showing the doubling time in the presence (+) or absence (−) of Dox in control MDCK cells, and in the different clones. Values for the two histograms represent the mean of three to five independent experiments (see Materials and methods).
Figure 5. Effect of cingulin overexpression on the localization of occludin and ZO-1 in MDCK cells. Immunofluorescent localization of GFP, GFP fused to full-length canine cingulin, head, or rod + tail domains (green), occludin and ZO-1 (red), either in the presence (+) or absence (−) of Dox. Merge images show co-localization. Single arrows (D′, E′, G′, H′, Q′, R′, S′, T′) indicate junctional labeling. Arrowheads (V′, W′) indicate cytoplasmic labeling. Images are representative of two independent experiments. Bar = 10 µm. This figure is reproduced in colour in Molecular Membrane Biology online.
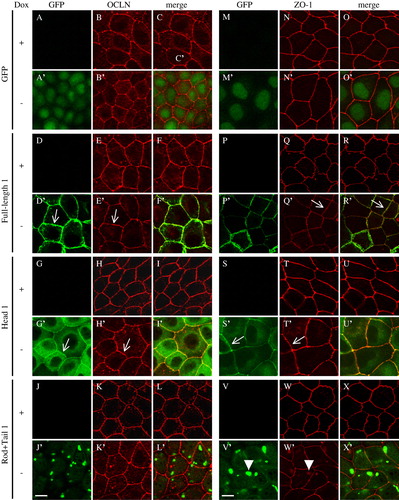
Figure 6. Effect of cingulin overexpression on TJ barrier function. Analysis of the transepithelial electrical resistance (TER, expressed in ohm.cm2) of MDCK monolayers during the calcium-switch assay. (A) Wildtype MDCK cells and clones expressing GFP alone, either in the absence (−Dox, empty symbols) or the presence (+Dox, full symbols) of doxycyclin (as indicated in the inset). (B) Clones expressing GFP fused to full-length cingulin. (C) Clones expressing GFP fused to cingulin head domain. (D) Clones expressing GFP fused to cingulin rod + tail domains. Values (see also ) represent the means±S.D. (error bar) of three to five independent experiments. Panel (E) shows the immunofluorescent localization of occludin at time 0, 4 h and 30 h from the beginning of the calcium switch, in Clone 1 expressing full-length cingulin (Full-length 1) and in Clone 1 expressing GFP. Arrowheads indicate discontinuities in occludin labeling observed in cells expressing full-length cingulin. Panel (F) shows immunoblot analysis with anti-GFP antibodies of lysates from three stable clones expressing full-length cingulin, in the presence (+) or absence (−) of Dox-. The anti-tubulin immunoblot was used as a protein loading control. Note that similar amounts of GFP-tagged protein are expressed in the three clones.
Table I. TER peak* during the Calcium switch.
Supplementary Table. PCR Primers used in qRT-PCR.