Figures & data
Figure 1. Ribbon representation of the crystal structure for MFS transporters. (A) E. coli GlpT. (B) E. coli LacY. (C) O. formigens OxlT. (D) E. coli EmrD.
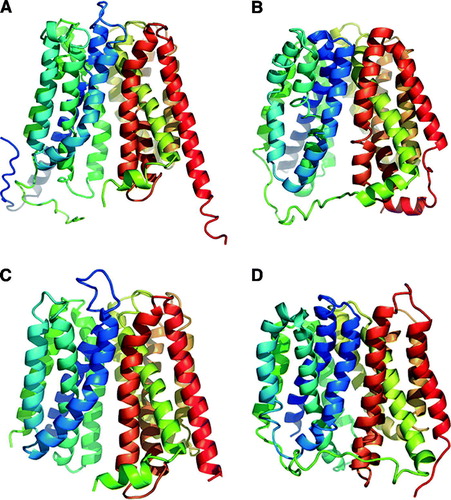
Table I. Summary of the different programs used to enforce constraints, modeling and refinement for eukaryotic MFS models based on crystal structures of prokaryotic GlpT or LacY.
Figure 2. Ribbon representation for models of eukaryotic MFS transporters. (A) Human Glut1. E. coli GlpT. (B) human G6PT. (C) Rat OCT1. (D) Rabbit OCT2. (E) S. cerevisiae Pho84. For a comparison with the structure of GlpT, see A.
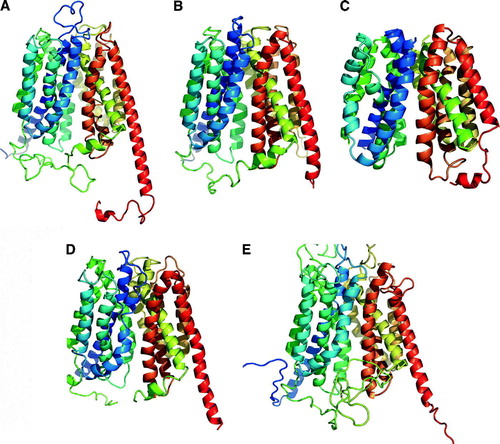
Table II. Reported sequence identities and sequence similarities of modeled eukaryotic MFS transporter proteins with GlpT sequence *Modeled using LacY. #Not reported in publication. Sequence identity and similarity calculations were carried out using EMBOSS Pairwise Alignment Algorithms with an open gap penalty 10, a gap extension penalty of 0.2 and BLOSUM62 matrix.
Figure 3. (A) Wall-eyed stereo image ribbon representation of the structural alignment between the GlpT crystal structure (green) and GlpT model (magenta) based on LacY crystal structure. (B) Wall-eyed stereo image of GlpT active site showing Arg 45 on transmembrane helix 1 and Arg269 on transmembrane helix 7 are in different locations on the GlpT crystal structure (green) and GlpT model (magenta) based on LacY crystal structure. Helices 2, 4 and 11 have been removed in order to visualize the Arg residues in the central cavity.
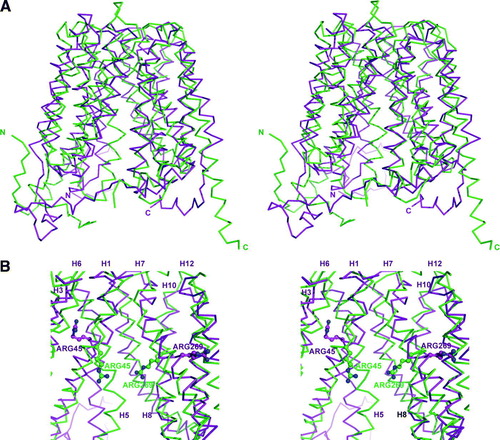
Table III. R.m.s.d. from structural-based Cα alignment using the program ALIGN (Cohen Citation1997). Numbers in parenthesis represent the Cα pairs in the alignment.*Modeled with LacY. $Alignment with all mainchain atoms with atom name match required.
Table IV. WHATCHECK assessment of X-ray and modeled transporter structures. Structure Z-scores, positive is better than average while negative is below average. *Modeled with LacY.