Figures & data
Figure 1. Transfection efficiency of ALA-DC and ALA-CatpH complexes as a function of the ratio A/D (a, c) and L/D (b, d). The cationic lipid to pDNA charge ratio (L/D) was kept constant at 4/1 for a and c, whereas for b and d the ALA to pDNA (A/D)ratio was kept at 10/1.
Figure 2. Circular dichroism of plasmid DNA (5 µg/ml) as a function of the ratio between ALA to pDNA (A/D) concentrations. ALA and pDNA concentrations are calculated per charge. pDNA in HBS curve is represented by a solid dark line and corresponds to the B-form of DNA. The following curves correspond to the A/D ratios of: 2/1 (dash-dotted dark line); 4/1 (dotted dark line); 8/1 (solid grey line); 10/1 (dash-dotted grey line); 16/1 (dotted grey line). T = 25°C.
Figure 3. Surface tension of ALA in the presence of pDNA. The surface tension is represented as a function of the ratio A/D (ALA/pDNA charge concentration ratio). The initial concentration of DNA is 189 µM. T = 25°C.
Figure 4. Liposome size distributions obtained from cryo-TEM images taken for the systems: (a) DC and (b) CatpH,. A population of 826 particles was analyzed for the system DC and a population of 924 particles was analyzed for the CatpH system. The later presents a broader size distribution.
Figure 5. The mean sizes ALA-DC and ALA-CatpH complexes as a function of the ratio A/D (a, c) and L/D (b, d) as measured by PCS. The cationic lipid to pDNA charge ratio (L/D) was kept at 4/1 for Figures (a) and (c). The ALA to pDNA ratio (A/D) was kept constant at 10/1 for Figures (b) and (d).
Figure 6. Cryo-TEM micrographs of the ALA-DC complexes at the L/D = 4/1; (a) A/D = 2/1; (b) A/D = 10/1. Unperturbed liposomes coexisting with some of the formed complexes (denser and darker particles) are also seen. T = 25°C.
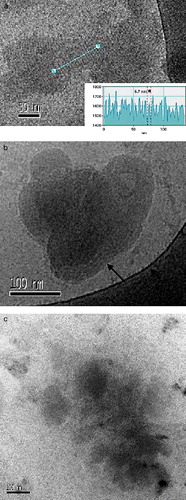
Figure 7. Cryo-TEM micrographs of the ALA-CatpH complexes at the L/D = 4/1. (a, b) A/D = 2/1; the electron density of the straight line represented in the image can be seen in the inset of this image; a spacing periodicity of 6.7 nm is shown for the multilamellar structures formed; the arrow in (b) indicates the same kind of striation as found in (a). (c) A/D = 10/1. No liposomes are seen. Some moderately dense particles are visualized. T = 25°C. This figure is reproduced in colour in Molecular Membrane Biology online.